No. 422 | October 30, 2026
☎️ Who—or what—are we missing?
On a panel a few weeks ago, I joked that the best reason to do polls might be to continue building a big database about polling error.
One way or another, that database gets a whole bunch of new entries next week.
This newsletter has focused quite a bit on the question of whether the polls might be wrong again this year. That focus has only intensified in the broader online discourse heading into election day.
That debate shouldn’t blind us to the reality that this should by rights be a terrible, horrible, no-good, very bad election for Republicans. The president’s job approval rating is 24 points underwater, wrong track outnumbers right direction by 2 to 1, and polls nationally show an average swing of 10 points left from the 2024 election results, putting any geography carried by Trump by 10 points at roughly even odds to be won by a Democrat. A large chunk of the Senate battleground is in states just to the right of this threshold, which should make Democrats slight underdogs—except for their advantage in candidate quality in a few of these states.
For 14 years, no party that’s lost a presidential election in a state by more than 10 points has won a Senate race without an incumbent in a regularly scheduled election. That streak looks likely to be broken somewhere this year.
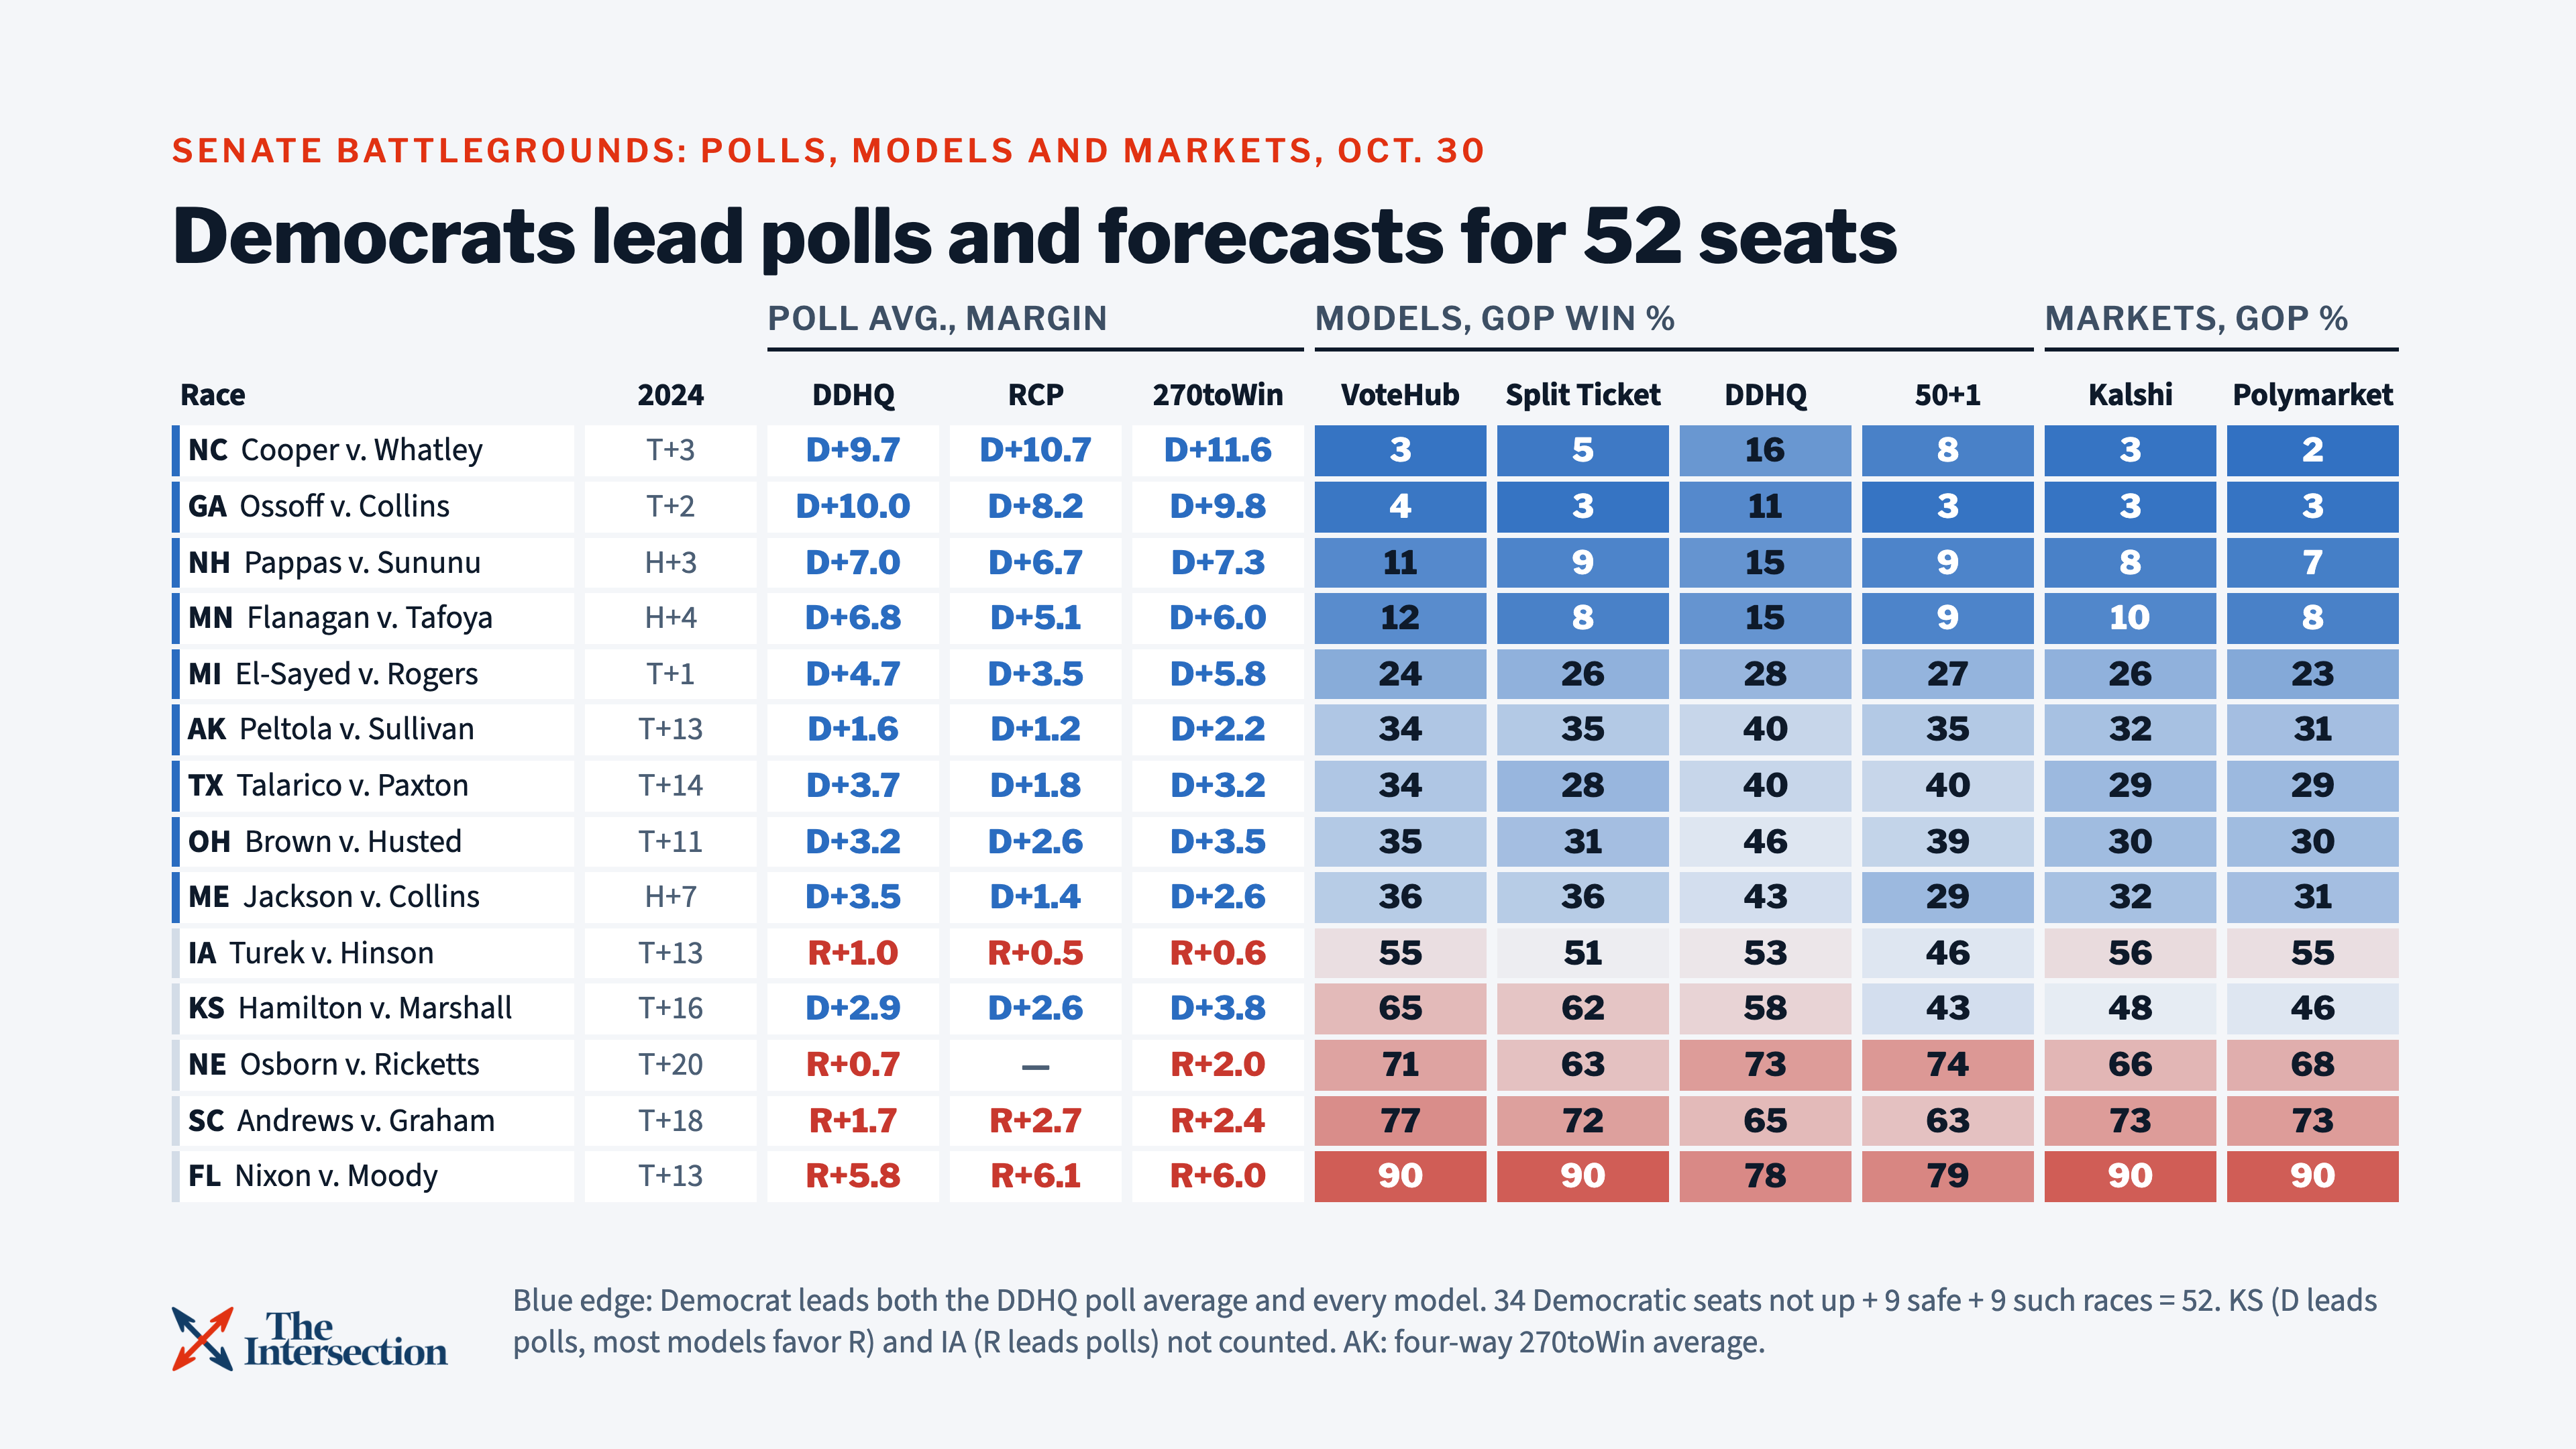
All caveats aside, if the national polls prove correct, Democrats should find a way to pick off two Trump +10 or more states for a Senate majority, the most logical two of these being Alaska and Texas, assuming they win all else that’s contested to the left of that.
But if there’s any national polling error in Republicans’ direction, those hopes can quickly begin unraveling.
Beyond the prospect of a big national polling error — always a possibility, but less of one given the accuracy of final midterm polls the last few cycles — there remains the prospect of a freakish, 2016-like error in the Midwest that hits in exactly the states that could prove decisive to the Senate majority: Michigan, Ohio, Iowa, Kansas. I should note that Democrats don’t in a strict sense need any of these states other than Michigan to get to 51, but falling short in some combination of Alaska, Michigan, or Maine or both would mean needing to win Ohio, Iowa — or both.
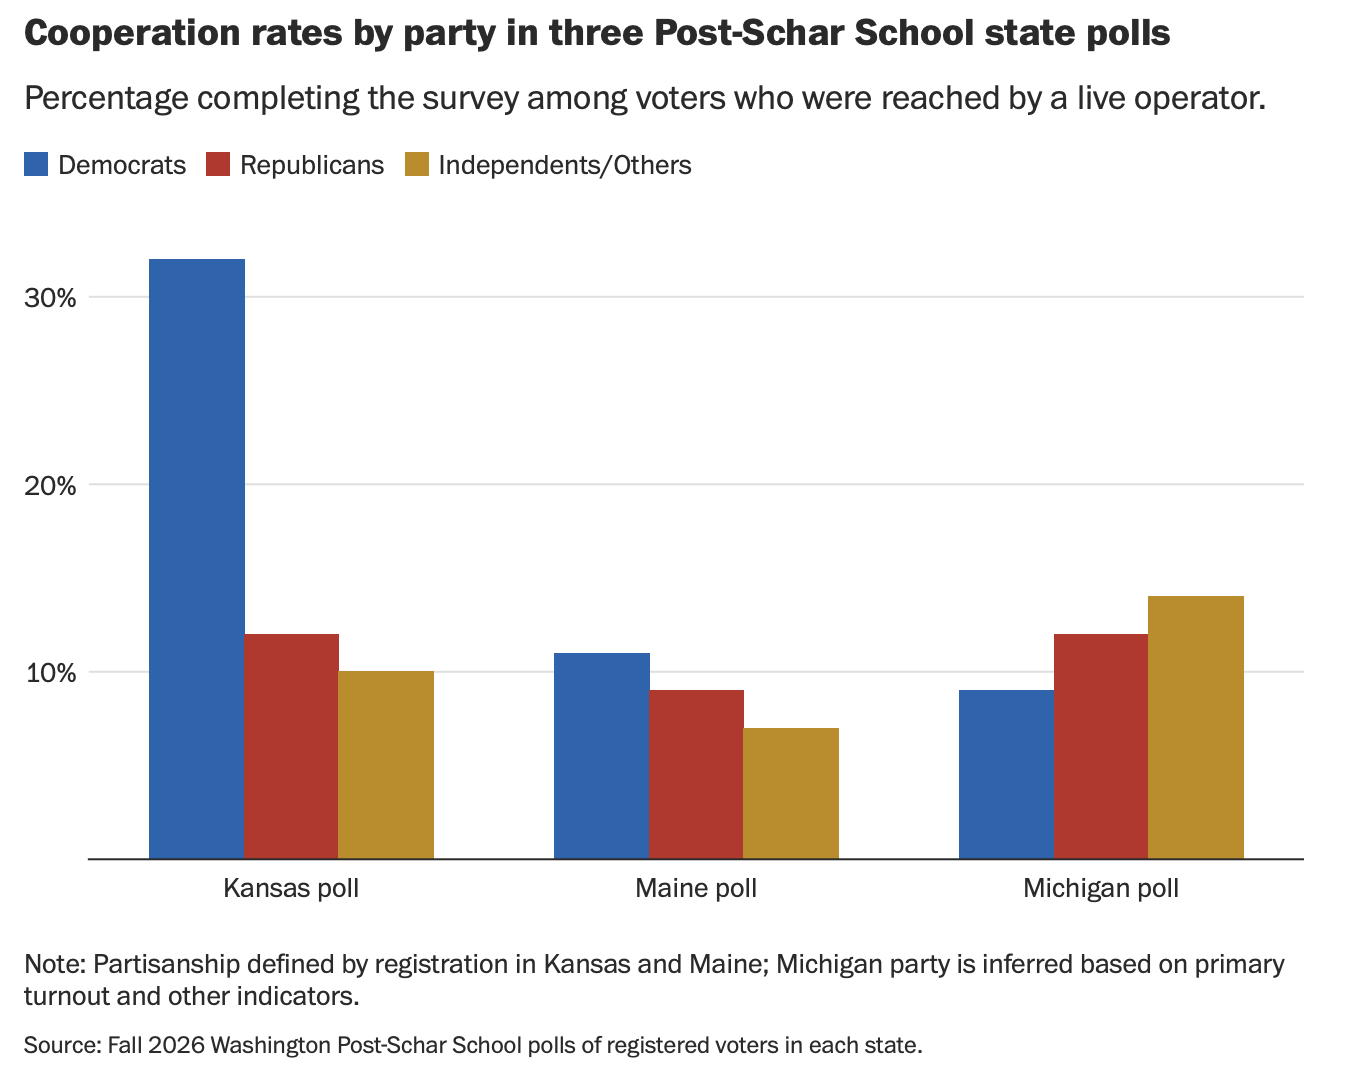
And it’s in exactly these states with a track record of bigger errors that warning signs about the polling are showing up. In the Washington Post-Schar School’s Kansas poll, the Democrats were more than twice as likely as Republicans to complete the survey. Almost always, gaps in response rates like this show up as an advantage for the side responding more, no matter how you weight them. This poll showed a Hamilton lead of 9 points.
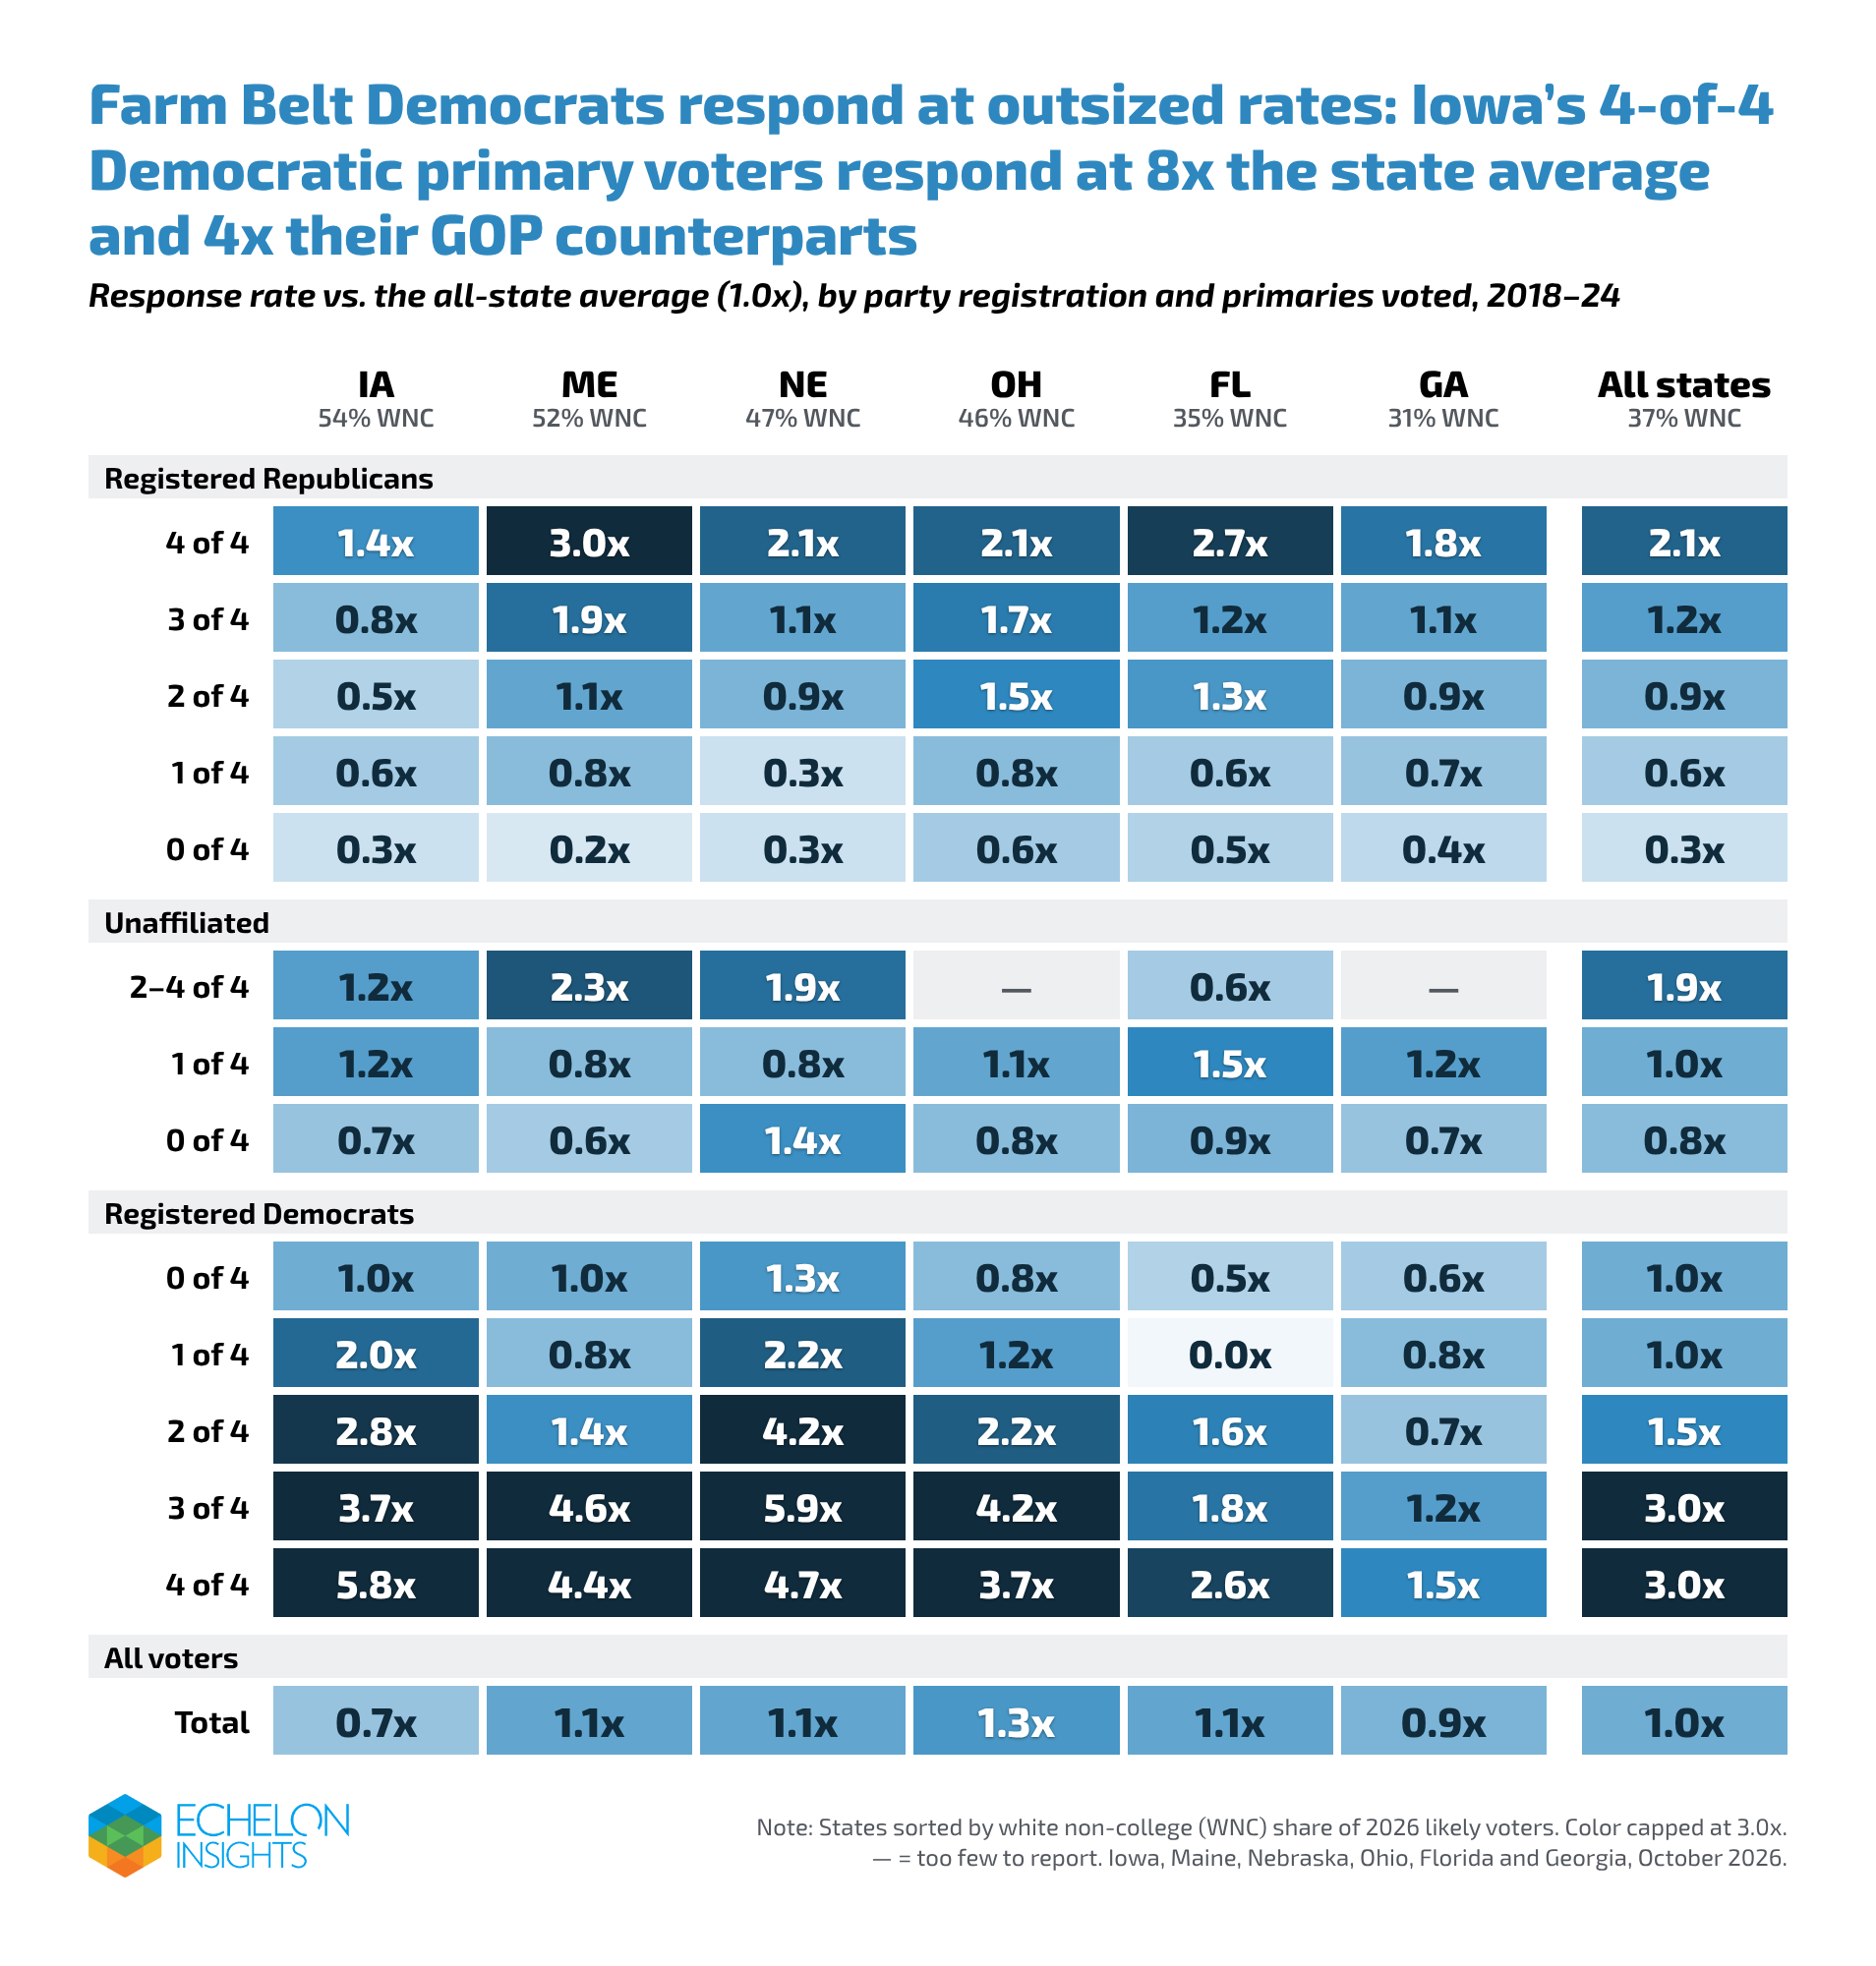
We see a similar Farm Belt pattern in our own polls. In Iowa, registered Democrats who voted in all four primaries from 2018 through 2024 responded at roughly four times the rate of their Republican counterparts. (The next most unbalanced state was Nebraska.) We made many more contacts with Republicans to correct this imbalance, but the issue you continue to see is highly partisan and engaged Democratic samples combined with reluctant Republican samples more apt to be skewed by defectors. The relative rates of defection in both major parties are the thing that changes your topline number the most.
Noah Wyhof-Rudnick raises the other side of the problem: weighting to recalled presidential vote may constrain the electorates pollsters allow their samples to represent. The issue isn’t herding to a final poll result, but herding to a certain 2024 recall (usually one varying degrees to the left of the actual 2024 result) that then changes in line with perceived changes in the political environment.
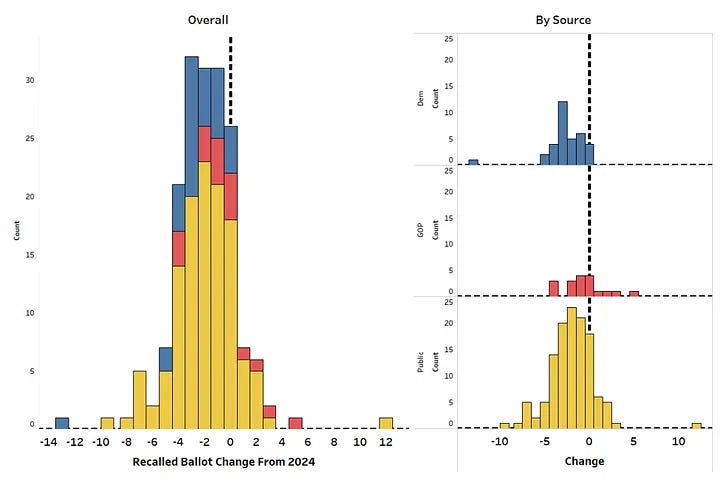
Then there’s the famous, almost-undefeated election model known as PTSD:


📮 What can the early vote tell us?
I’ve been a skeptic of most early vote analysis, so naturally I’ve decided to try my hand at it.
You can sign up here to get access to Echelon’s national early voting dashboard. And what you’ll get is less about a simple cycle-over-cycle comparison of ballots returned but a projection of what the current pattern of ballot returns is telling us about the electorate that’s yet to vote. When you line up returned ballots to a turnout model and how these same voters came in during previous cycles, does this predict over- or under-performance for one party or the other?
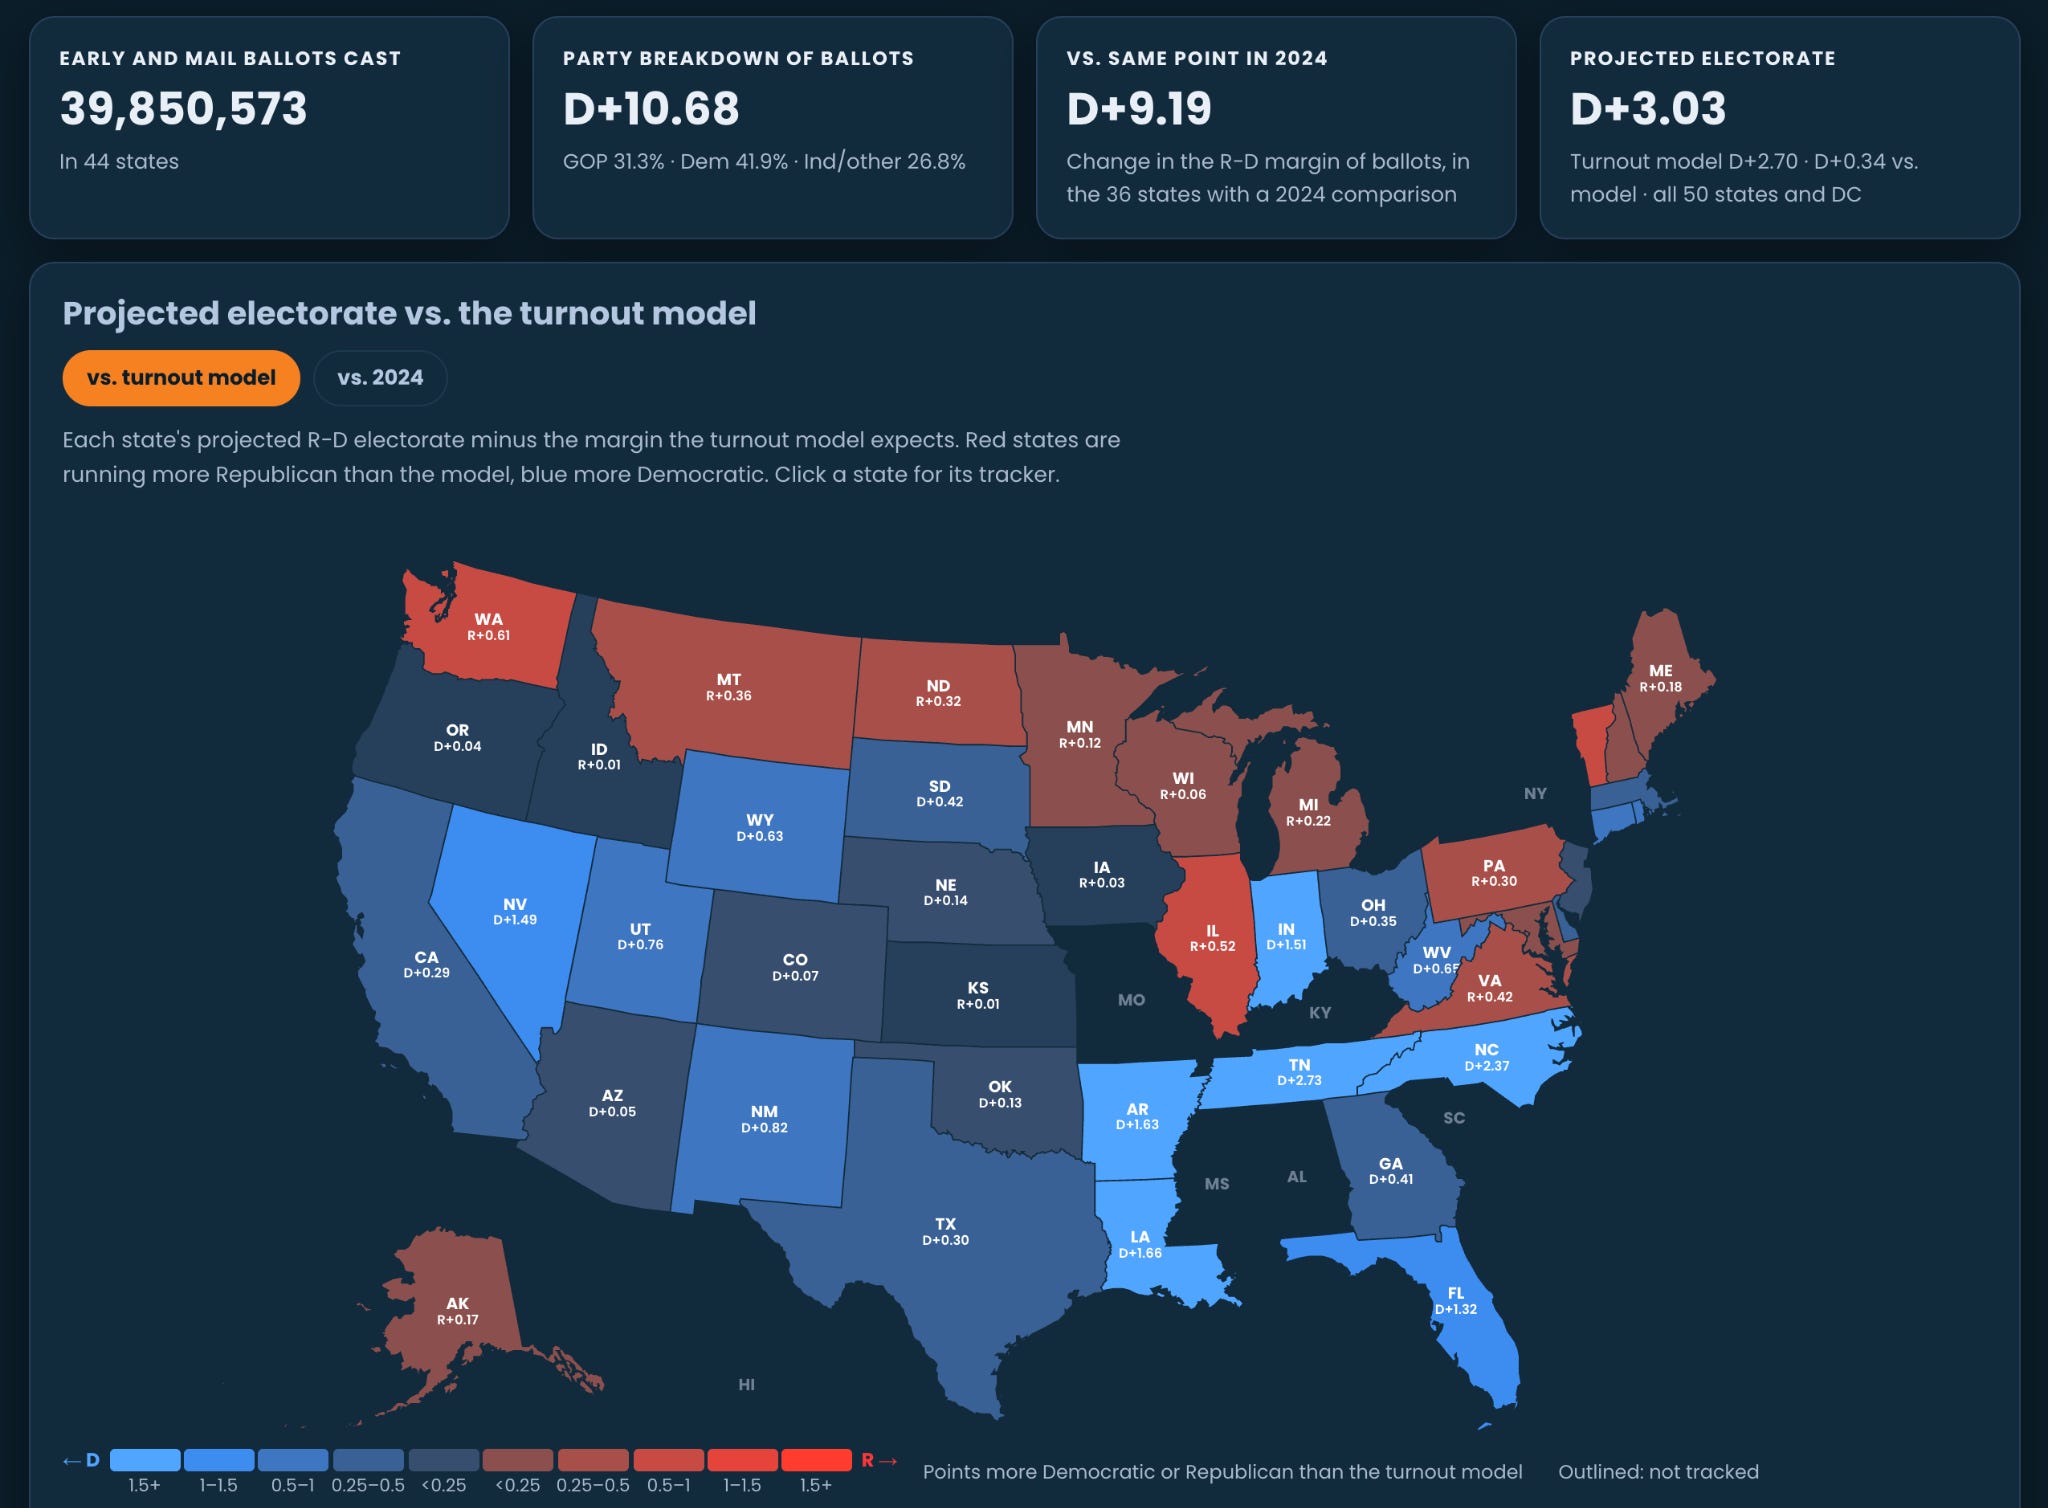
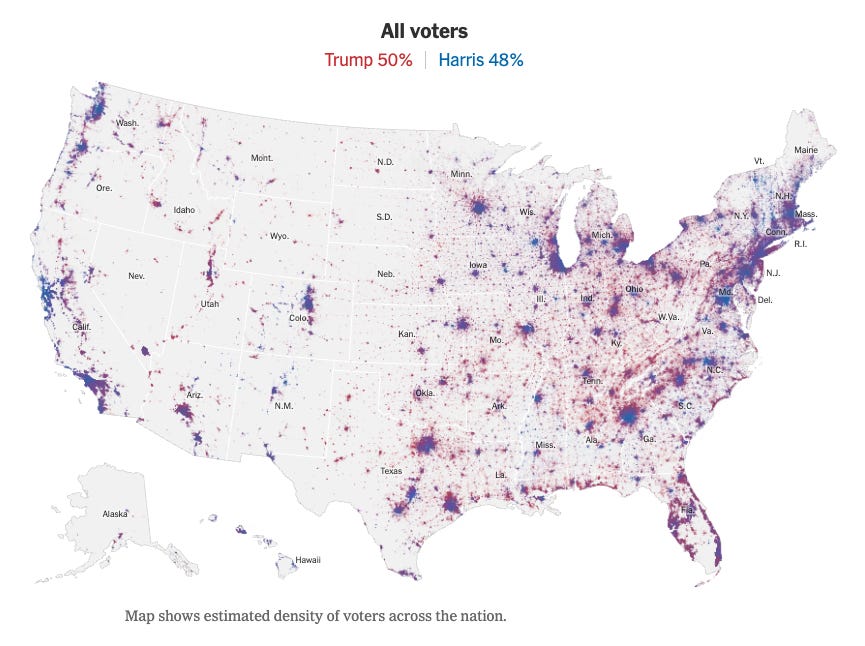
So far, the electorate is coming in much bluer than 2024 — something our turnout model already expected, and it’s edged slightly more towards Democrats as more ballots have come in. Right now, the results are in line with a 2018-like midterm — more a wave than a tsunami. And the map above shows how each state is trending relative to the model. Perhaps unexpected is that sharing a border with Canada seems to predict a slightly stronger than predicted Republican showing. You can explore these results in every state and Congressional district with available data.
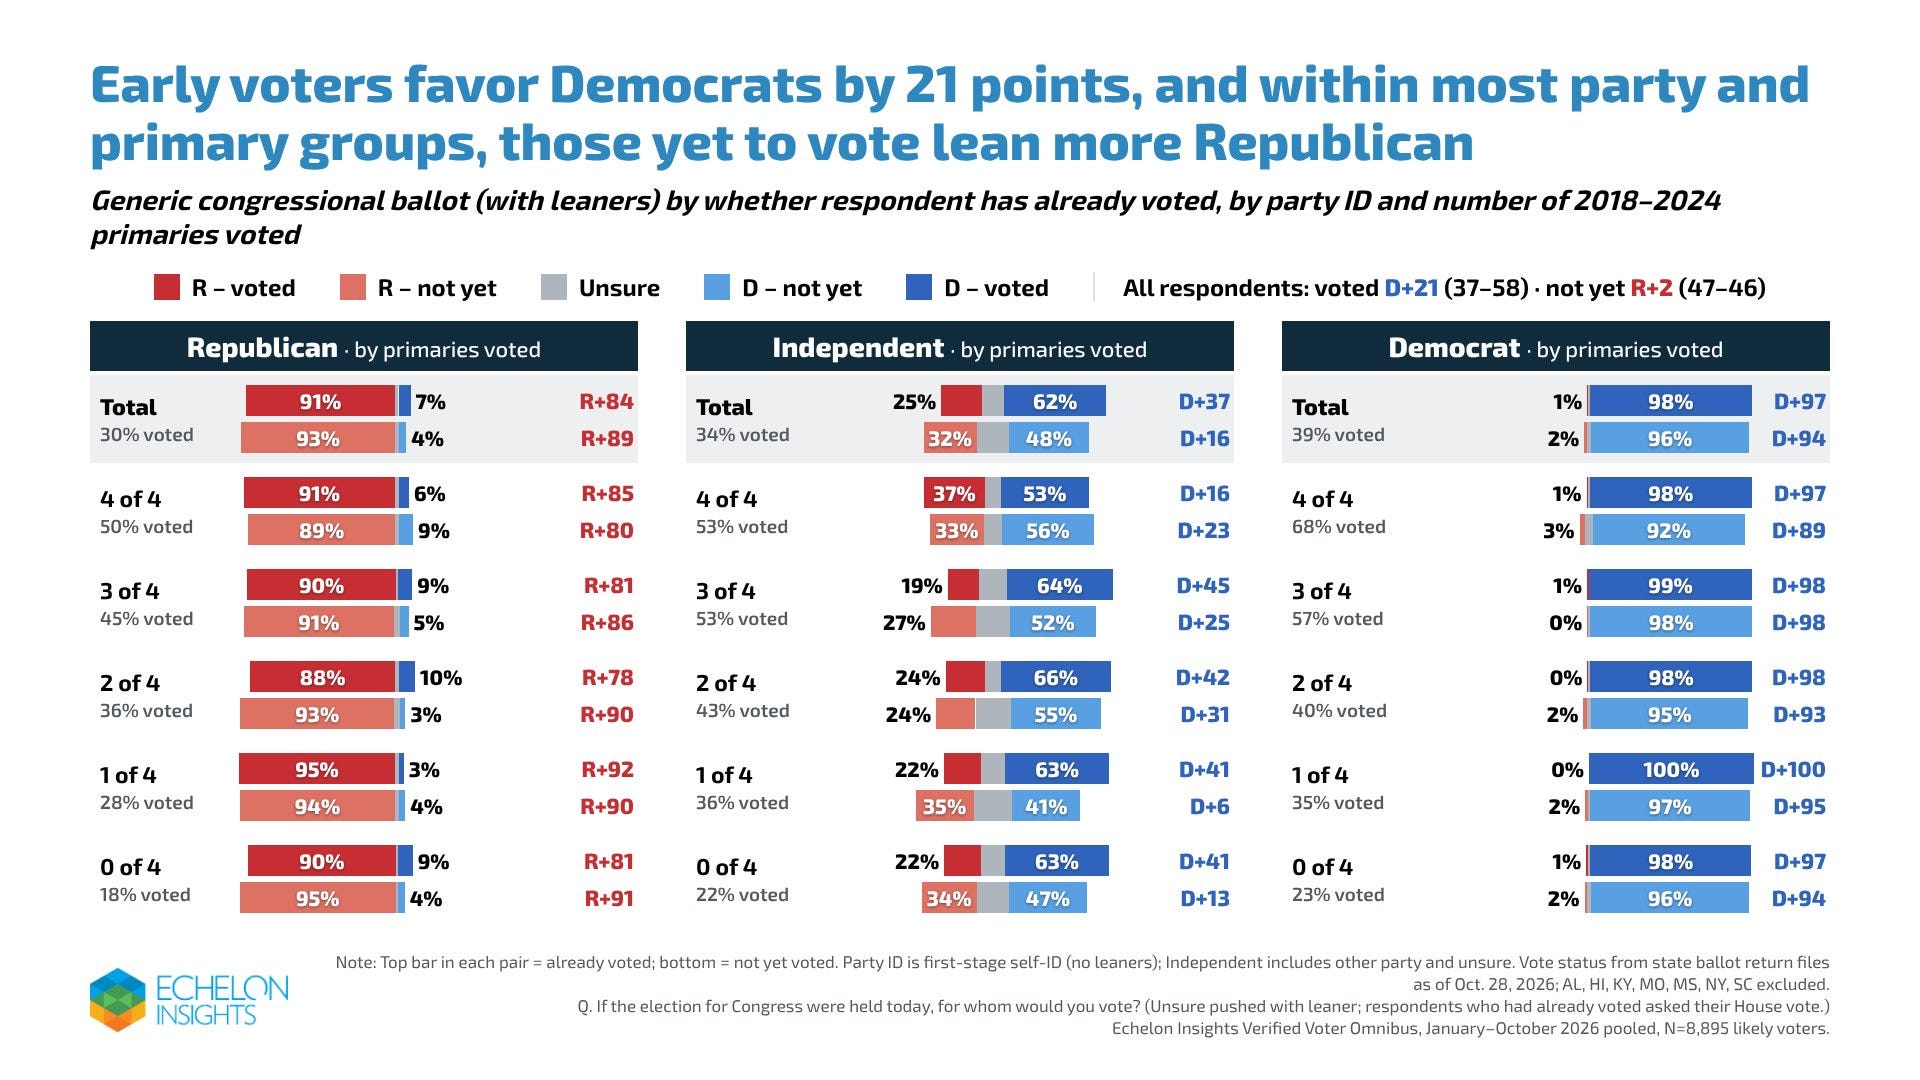
Lining up early voting data with our polling throughout the year shows Democrats ahead by 21 points among those who have already voted. But within most party and primary-voting groups, people who have yet to vote lean more Republican.
📺 Join me live on Election Night
On Election Night, I’ll be joining CBS News starting at 5 p.m. ET. More details here:
In addition to its main election night broadcast, CBS News will offer a dedicated live election analysis program on nonlinear platforms for the first time in its history beginning at 5:00 PM ET. This program, affectionately titled ELECTION 2026: THE NERD SHOW, will be hosted by CBS News’ Executive Director of Elections and Surveys Anthony Salvanto and CBS News Congressional Correspondent Caitlin Huey-Burns, and they will be joined by Democratic and Republican pollsters and other election data experts. The program, which will stream live on YouTube, X, CBS News 24/7 (from 5pm-7pm), CBSNews.com, the CBS News mobile app, and the CBS News connected TV app on smart television devices, will feature a deep dive into the key numbers, counties, results, and issues that are driving how the election is unfolding. THE NERD SHOW will also feature data analysis provided by VoteHub, an independent and nonpartisan political media organization that CBS News partnered with last month to incorporate election data, maps, survey aggregation and analysis into its midterm coverage across platforms, and Kalshi, CBS News’ official prediction market sponsor.
🌻 What would it take for Democrats to win Kansas?
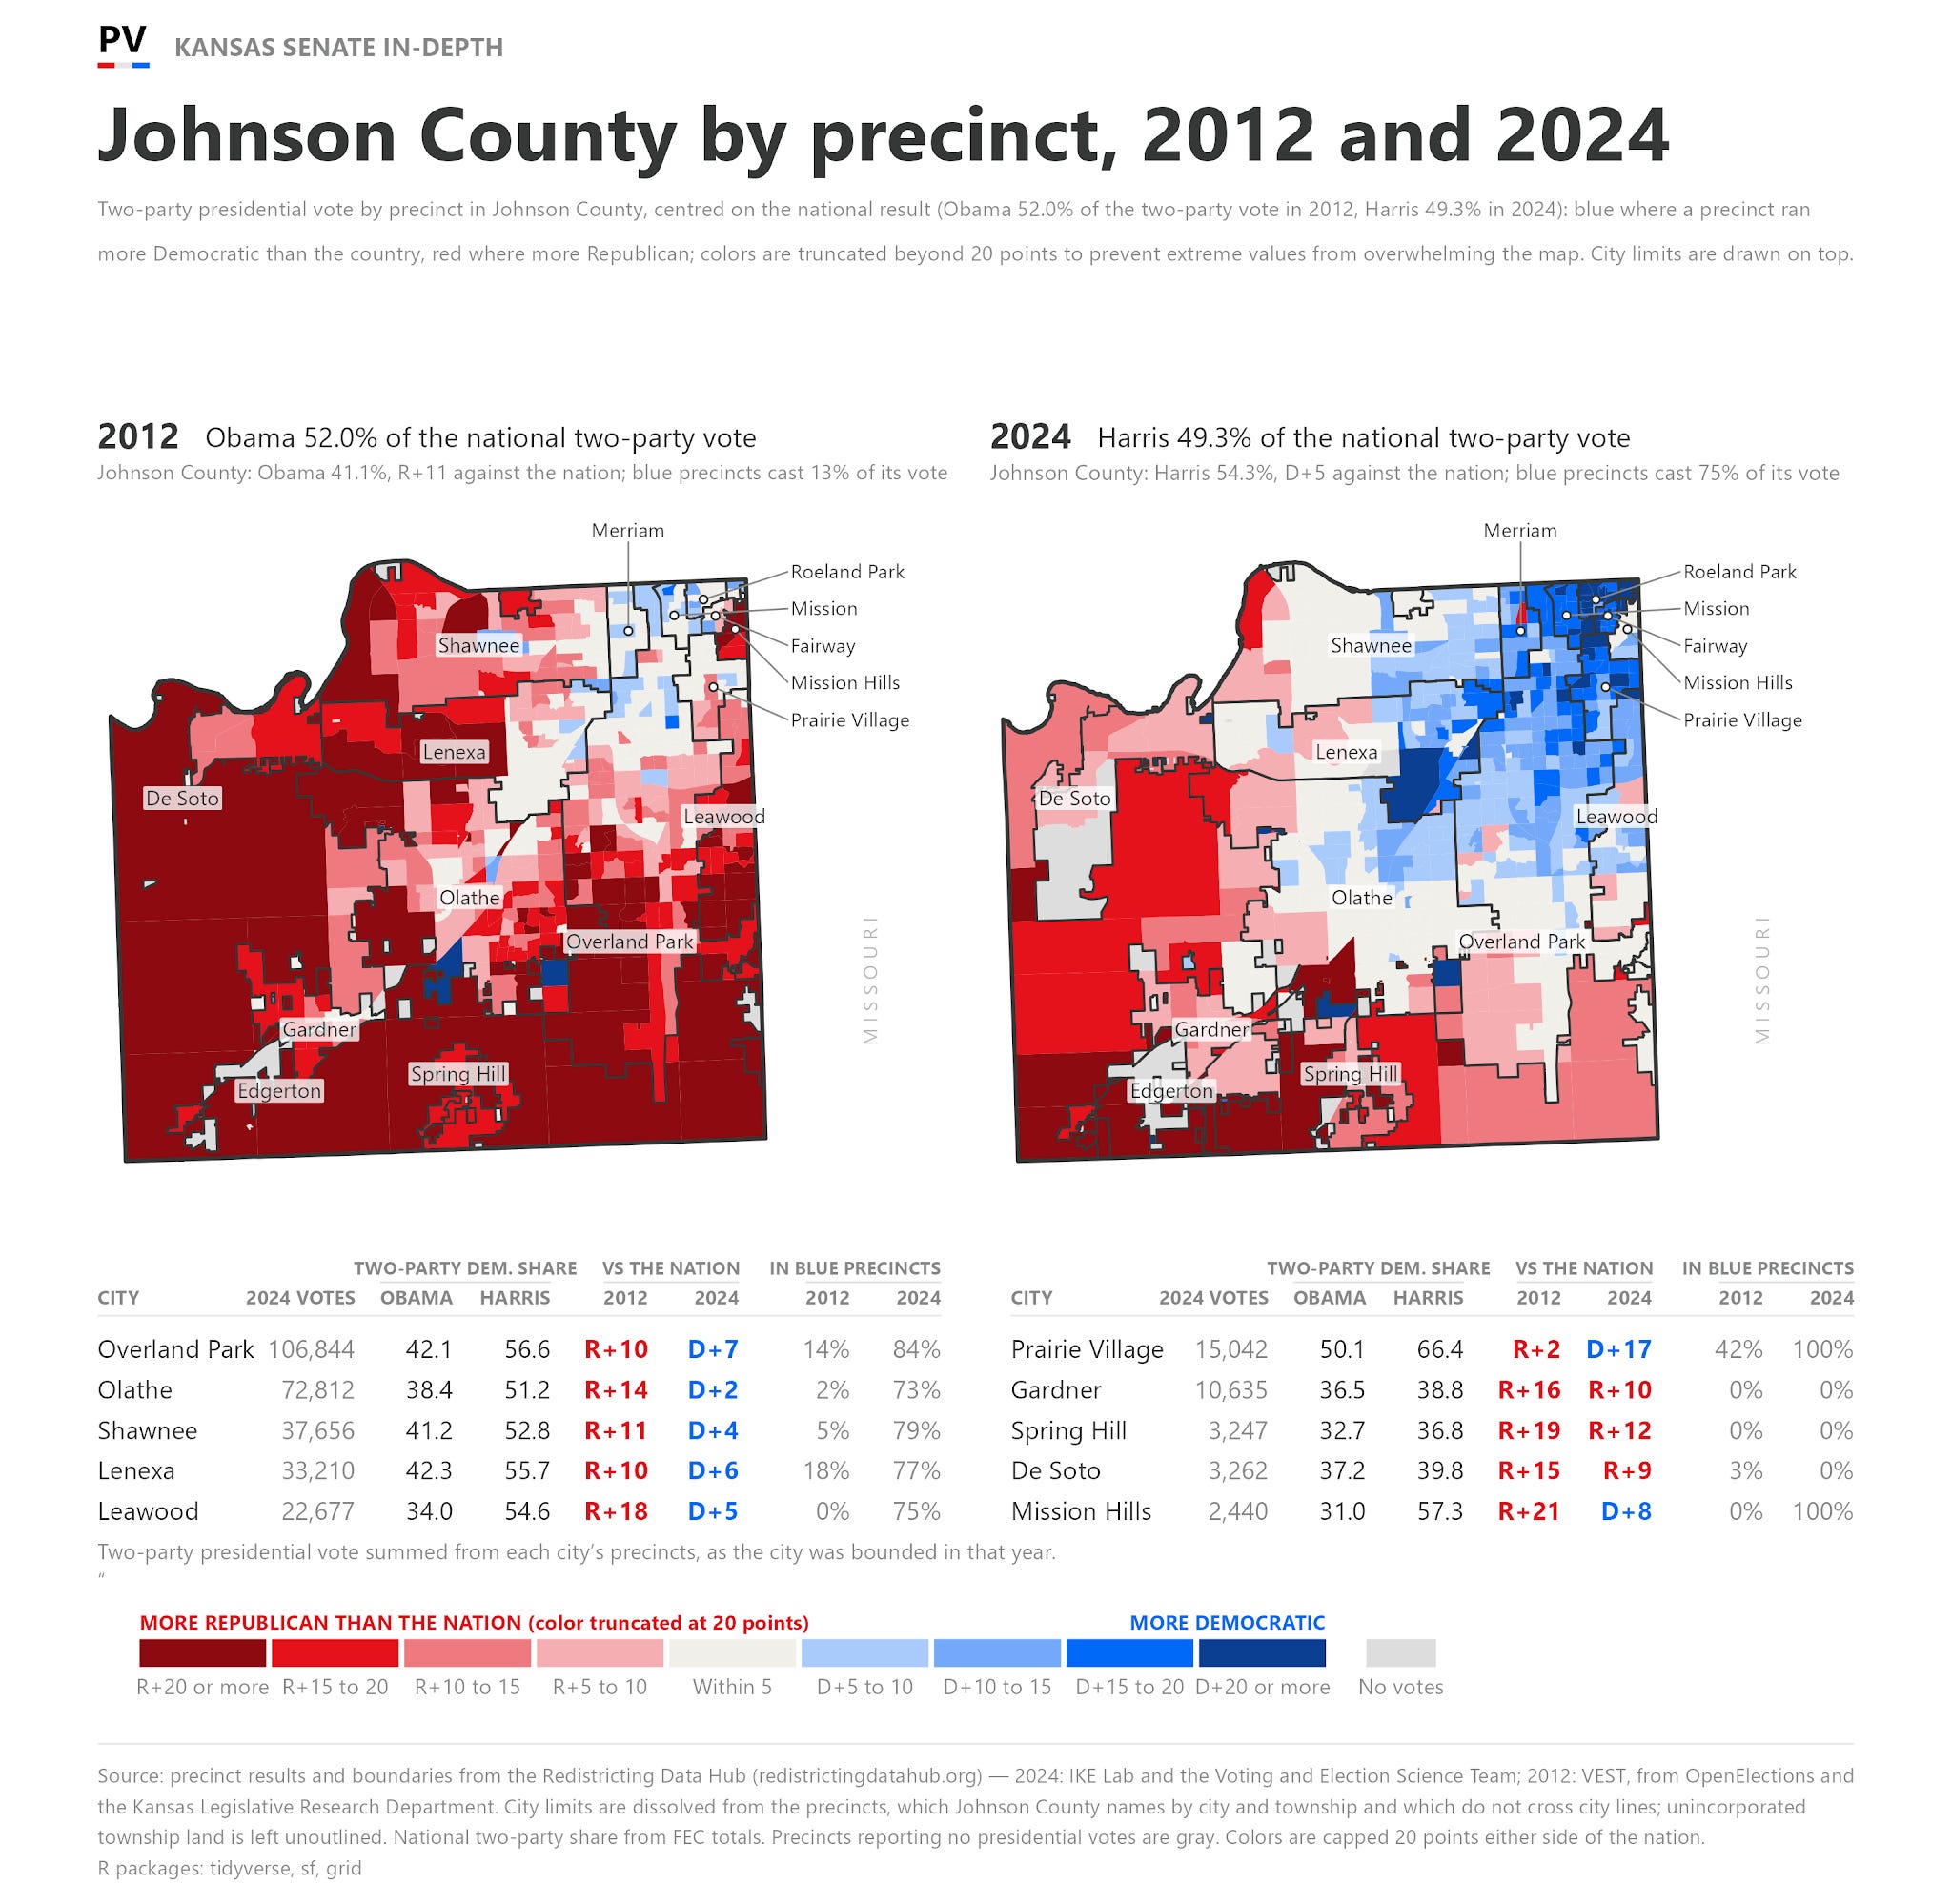
Sean Trende’s deep dive gives us geographic texture behind the polling debate. Johnson County has become the Democratic base: the share of its two-party vote cast in precincts to the left of the nation rose from 13% in 2012 to 75% in 2024. But suburban gains alone won’t make Kansas a blue state. Only Republicans staying home could do that.
⚒️ New tools to follow the 2026 election
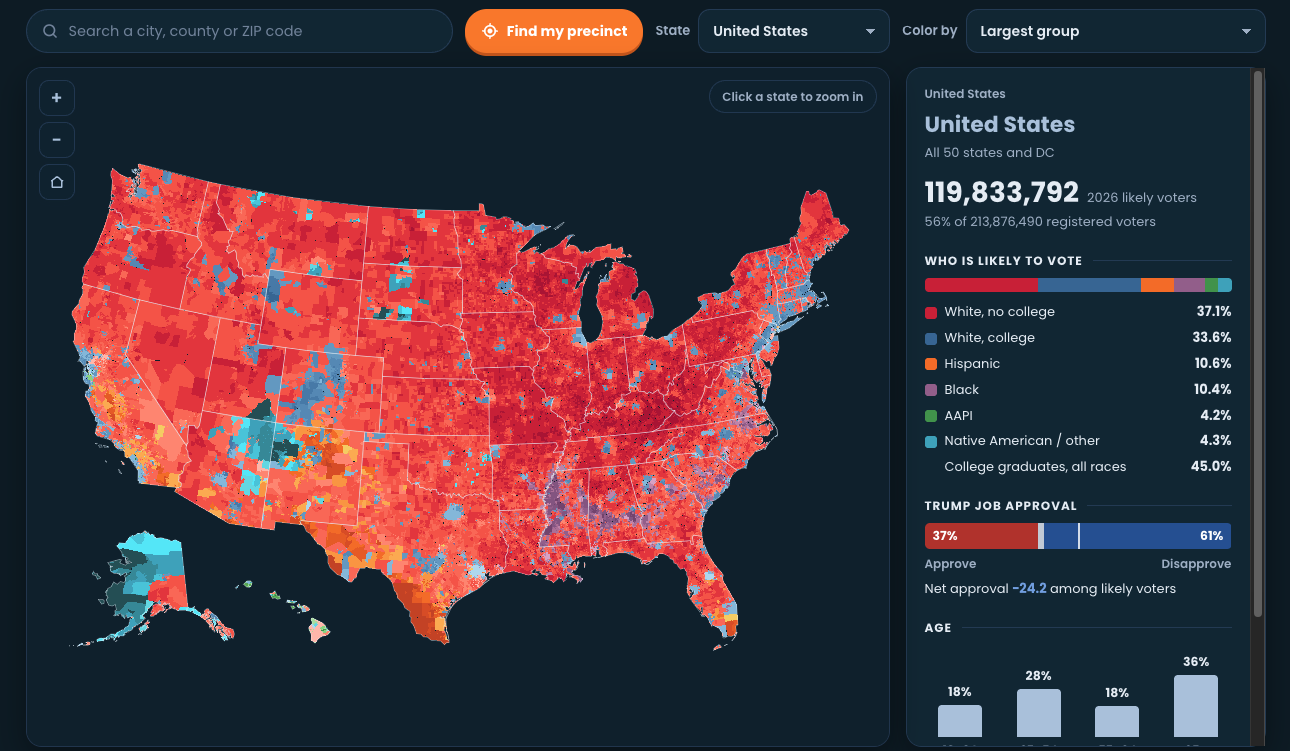
Echelon’s 2026 Electoral Census lets you see turnout estimates, demographics, and Trump approval for every state, district and precinct in America.
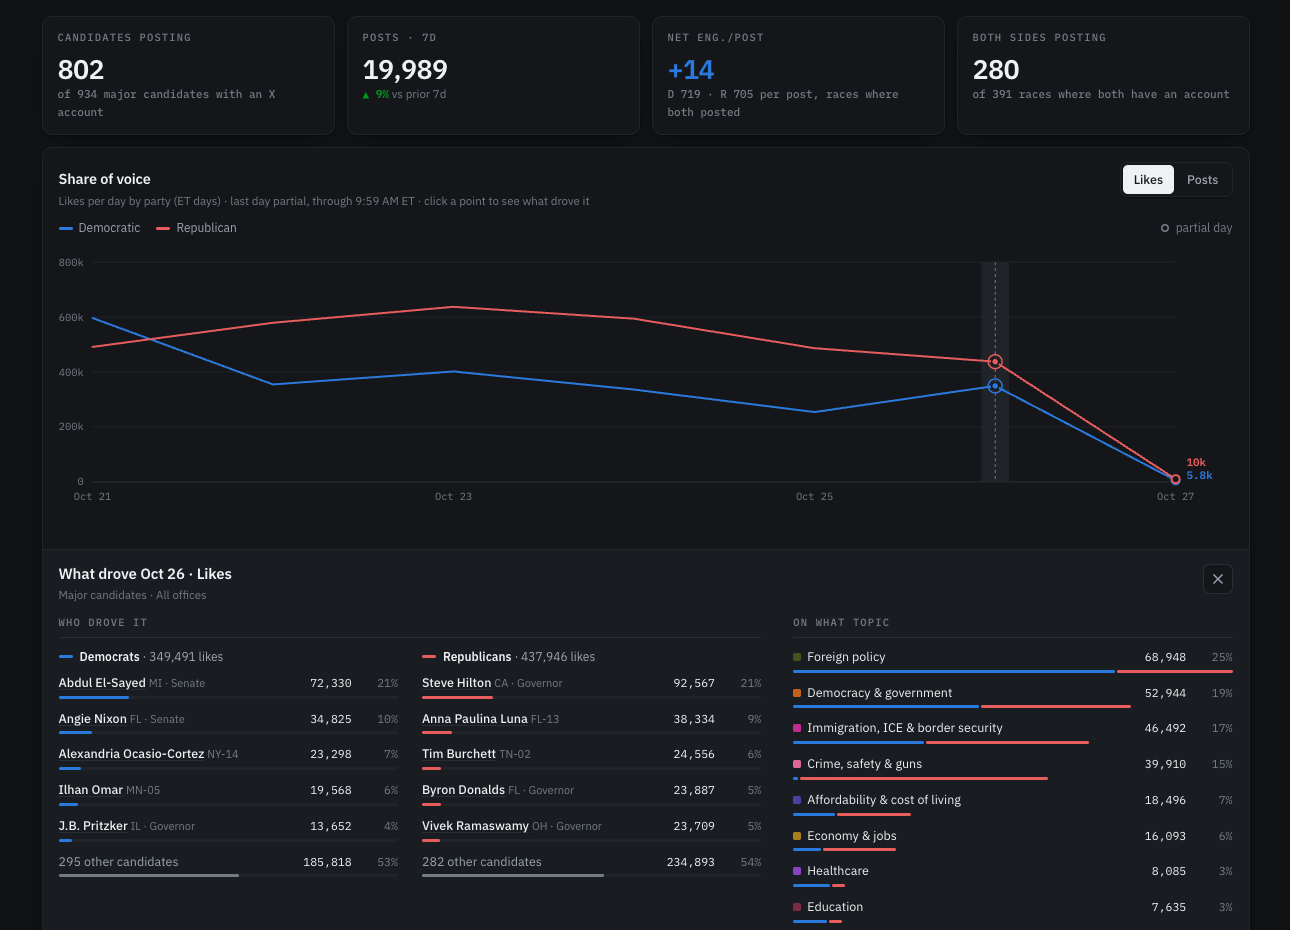
And Echelon’s Midterms Digital Tracker shows how often candidates post, how much engagement they get, and what they’re posting about. It’s another way to follow what the campaigns are talking about in the closing days.
🌊 How far could the wave reach?
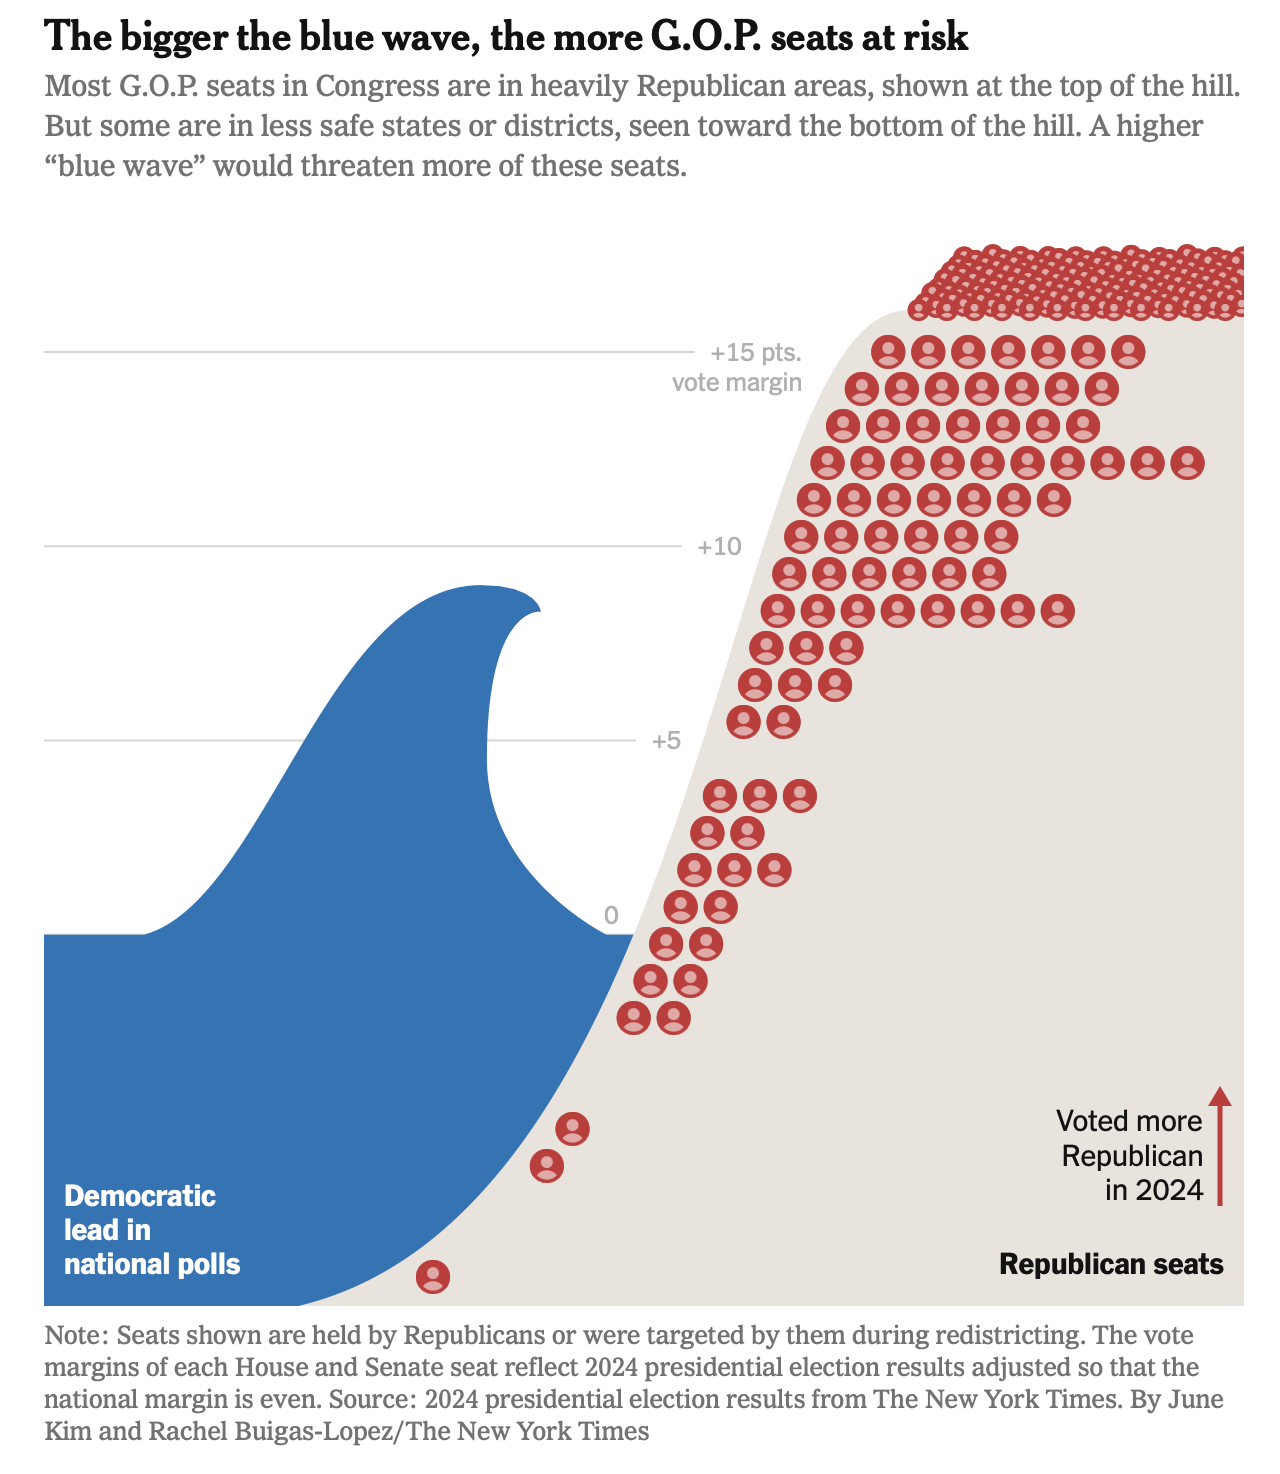
The Tilt outlines four possible midterm outcomes and potential heights of the blue wave. Its graphic puts the national environment alongside the Republican seats that Democrats would need to reach.
🗺️ Mapping the electorate
The New York Times’ Voter Trends should go straight to your bookmarks. It tracks how different demographic groups voted in the 2020 and 2024 elections — and will be updated on election night.