No. 419 | October 9, 2026
🗳️ A new home for all of our midterm analysis
All of our interactive election analysis features this cycle now live in one place, including previews of the House Swingometer, 2026 Polling Index, and our new Senate Explorer tool, as well as analyses of the primary vote in three critical states: Texas, Ohio, and Iowa.
With 25 days to go, let’s run through all the latest numbers.
The median Swingometer scenario now sits at 232 D - 203 R, with more potential for Democrats to rack up gains now that they’ve crossed the “valley of redistricting” and are actively contesting a higher volume of seats in the Trump +9 or more range.
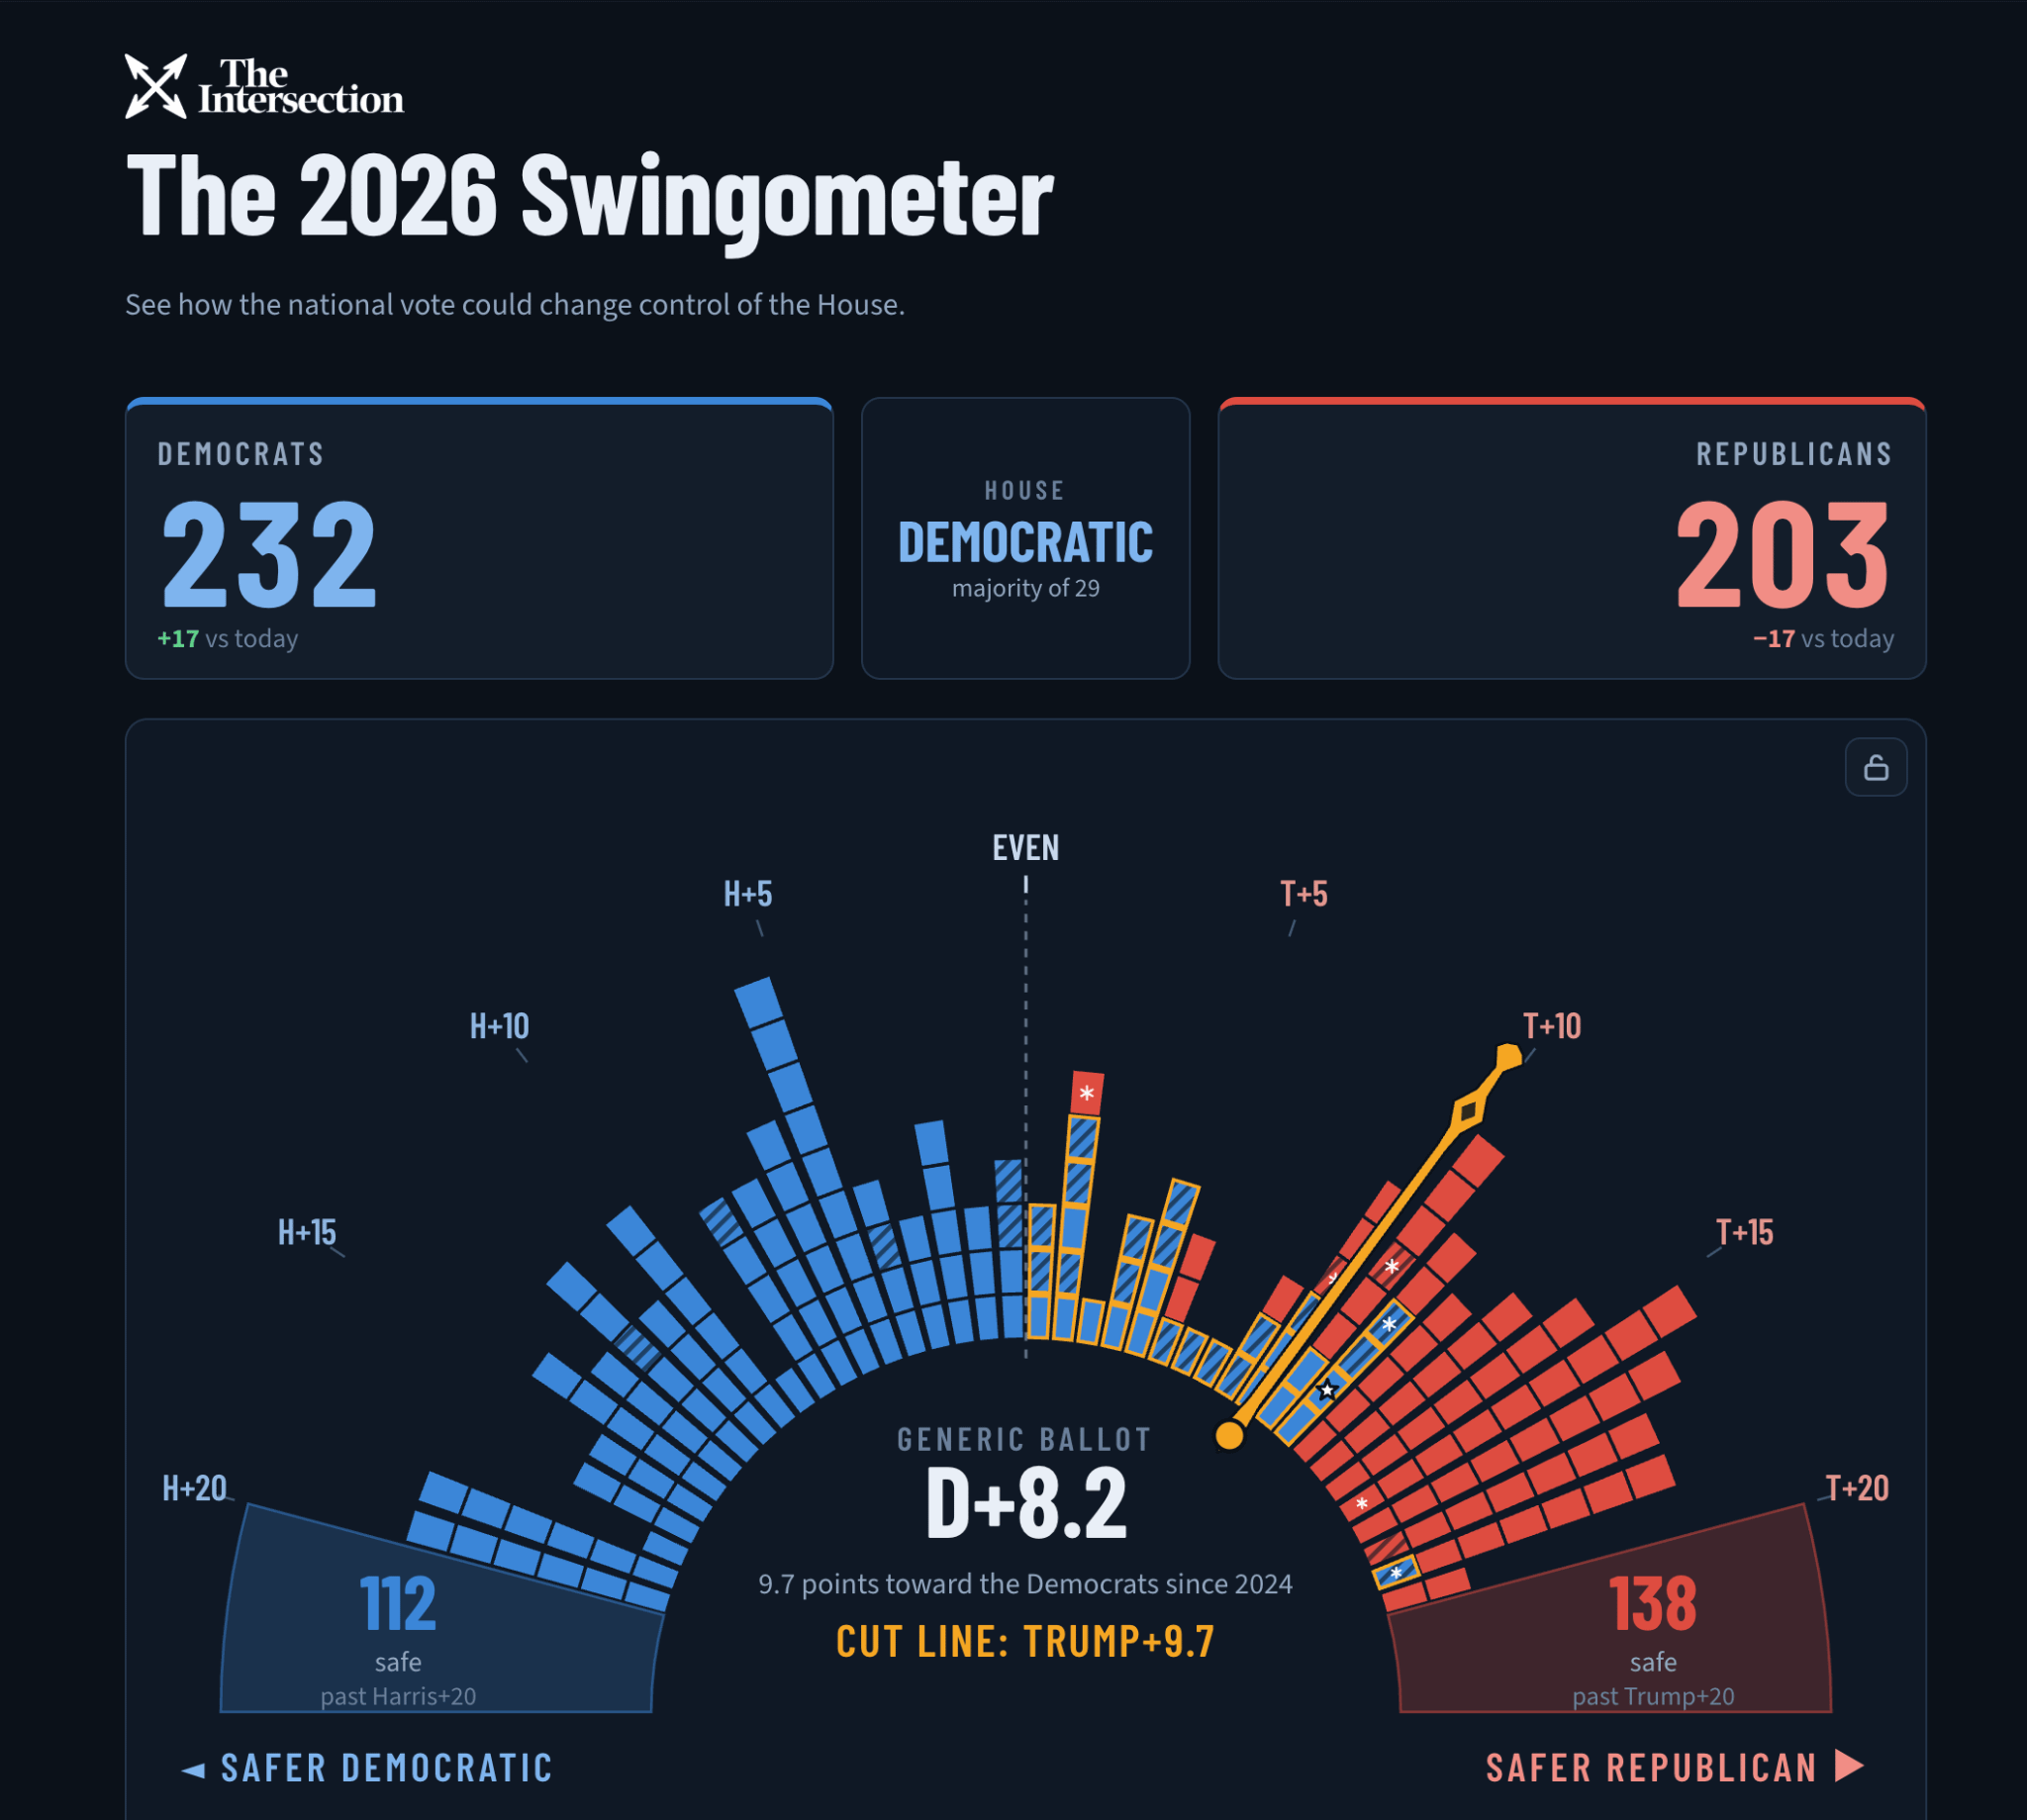
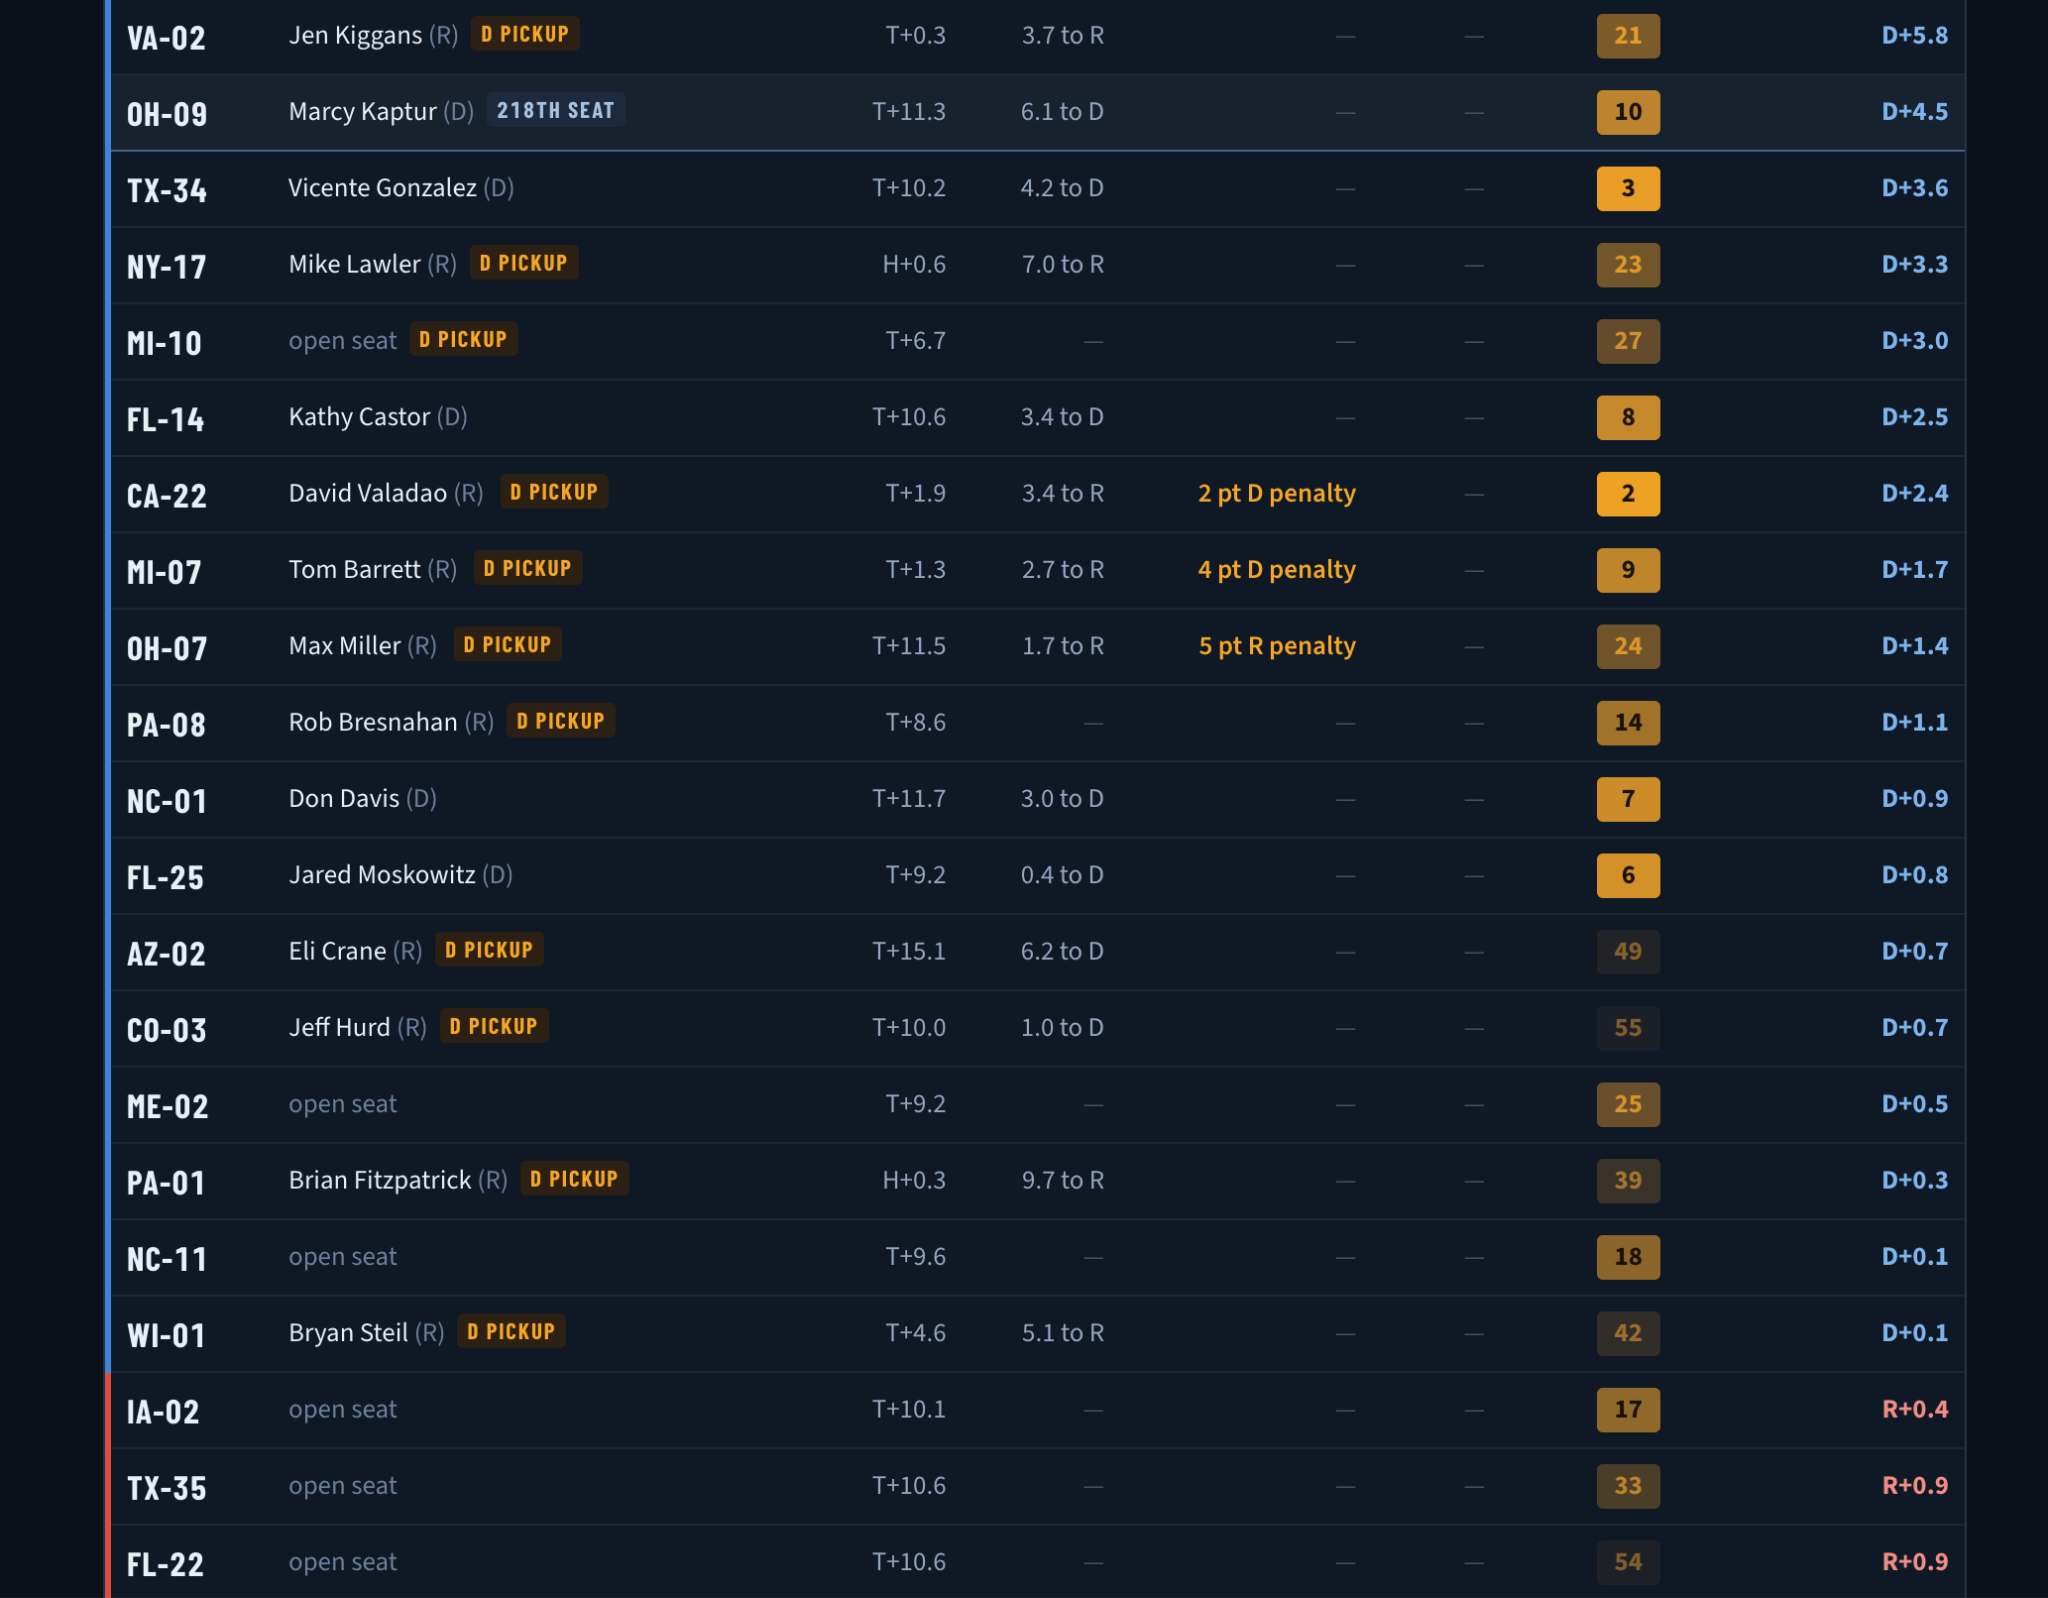
Our read on the most competitive House districts is now enhanced by outside spending rankings drawn from Rob Pyers’ big board (in yellow boxes).
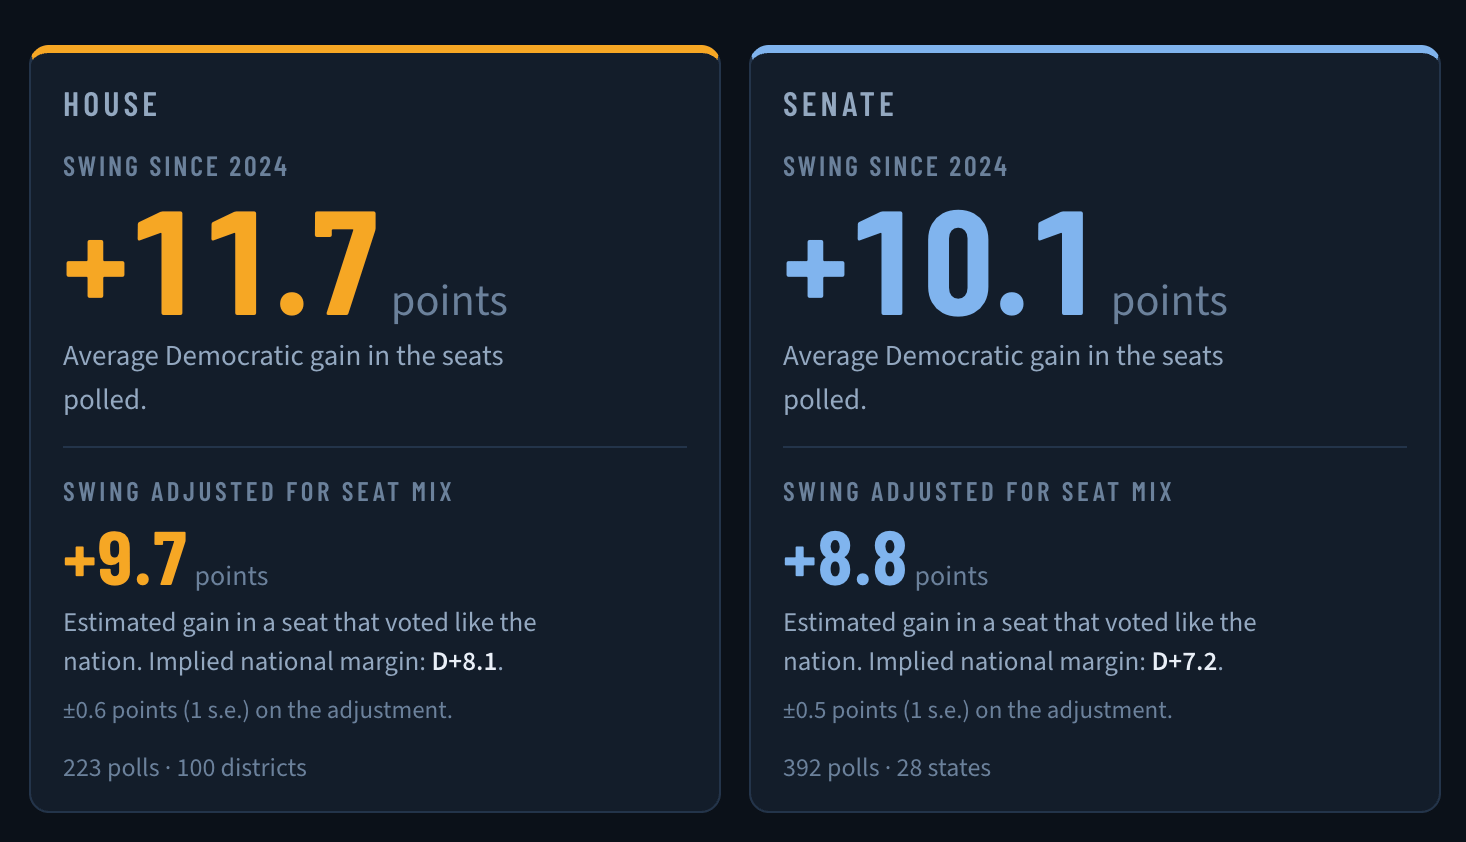
The Polling Index agrees — implying a national environment between D+7 and D+8. The average House poll has swung 11.7 points left from 2024 and the average Senate poll 10.1 points left, numbers which get adjusted based on the red-leaning nature of the congressional battleground. In a flip from recent weeks, the Senate environment is a touch less blue than the House environment.
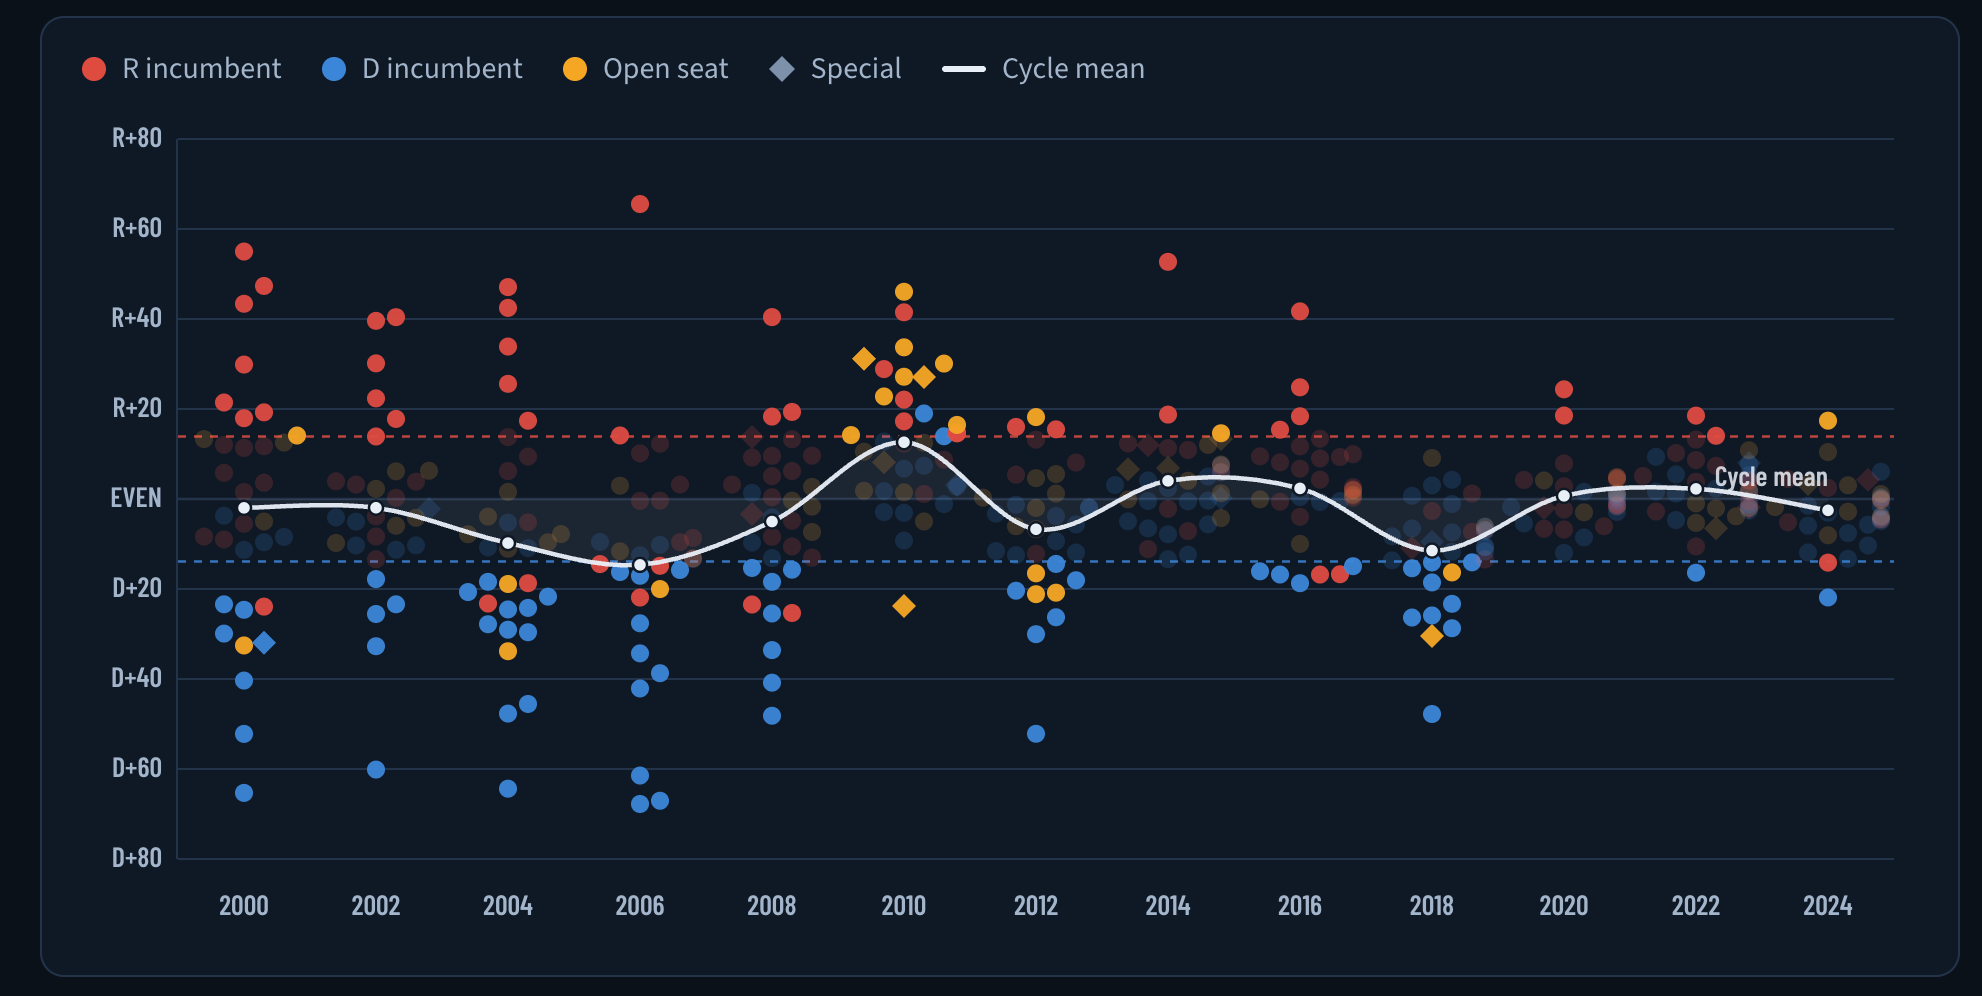
Then there’s the new Senate Explorer — a historical look back at 440 U.S. Senate elections since 2000. Here you can really see just how much more partisan U.S. Senate elections have gotten. Map out how many Senate races were decided outside different swing levels from the last presidential election — including a Texas-specific margin:
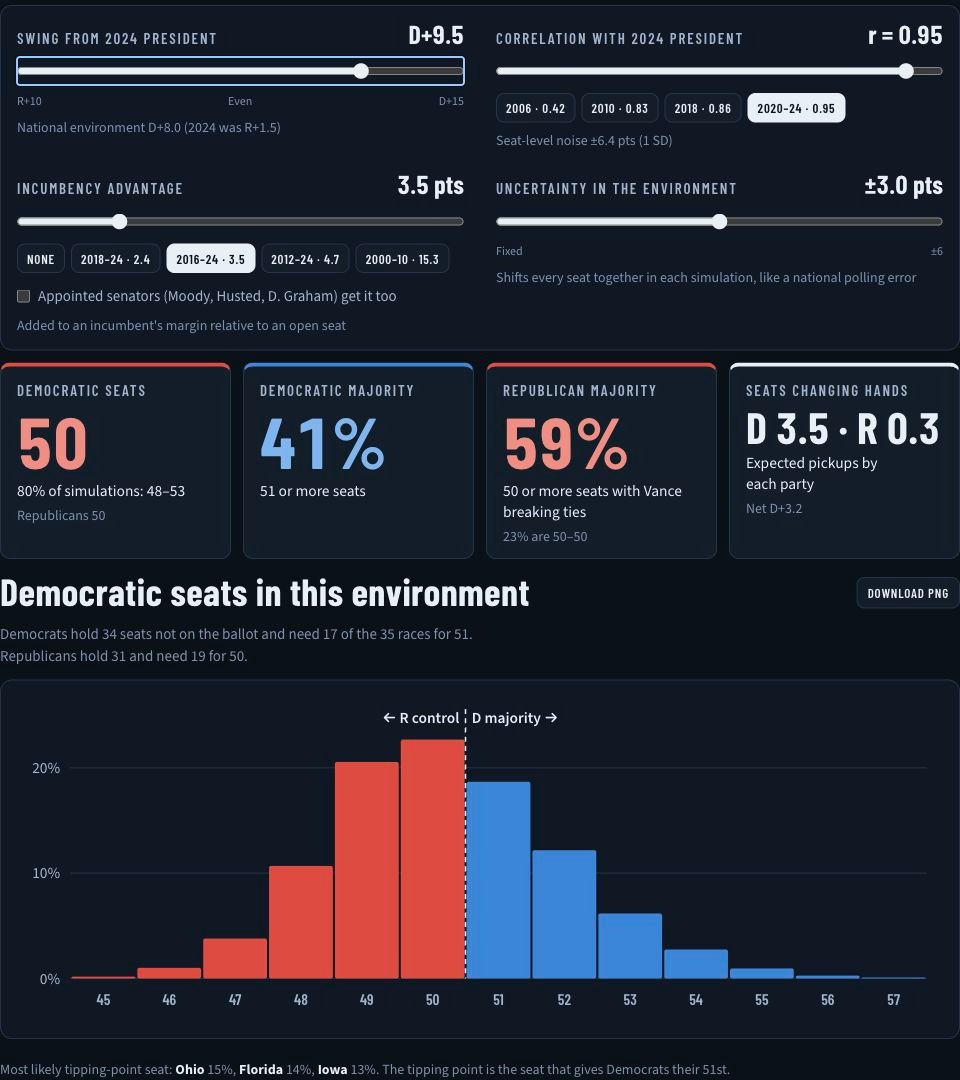
And then run your own Senate fundamentals scenarios, adjusting for the political environment and the level of correlation with past presidential results. This shows you how different some specific races — places like Alaska, Maine, and Michigan — are because of the specific candidate dynamics there.
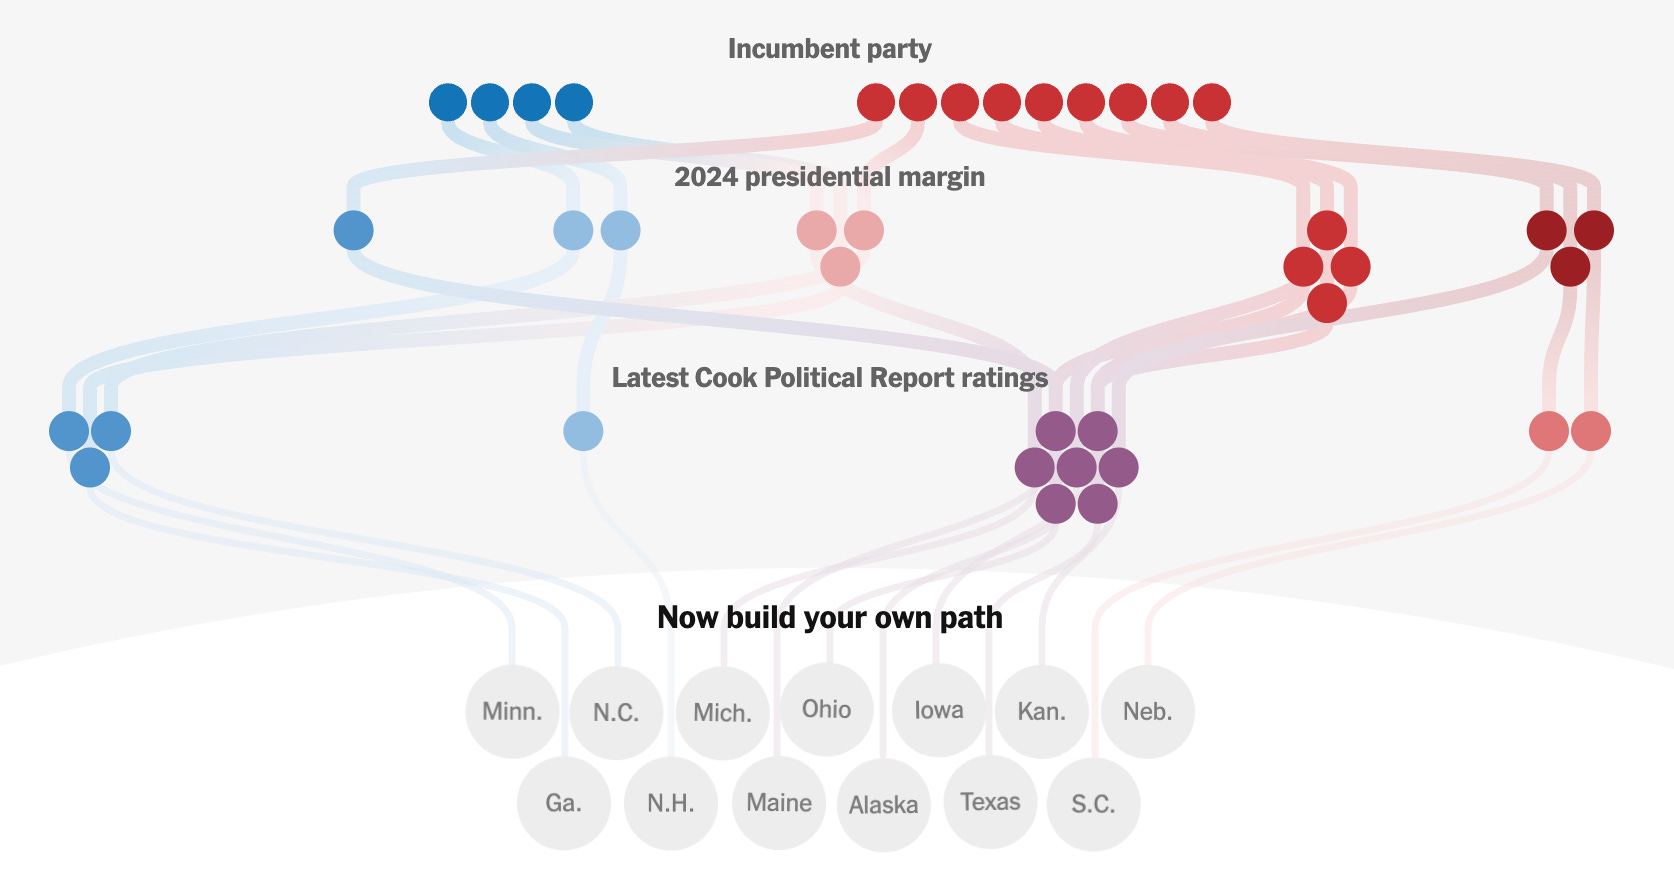
Another fun take on Senate scenario building comes from The New York Times.
🔄 The realignment realigns
The Argument’s new analysis puts Democrats ahead by 6.6 points among registered voters and 9.1 points among its modeled likely electorate. Among Hispanics, the Democratic margin rises from 20 points among registered voters to 26 among likely voters.
The estimates combine The Argument’s surveys and include voting history, demographics, and stated vote likelihood to model turnout. The political environment is shifting towards Democrats, but many of the projected gains come from Republicans sitting it out instead of persuasion.


🌽 What if there’s another Midwest polling error?
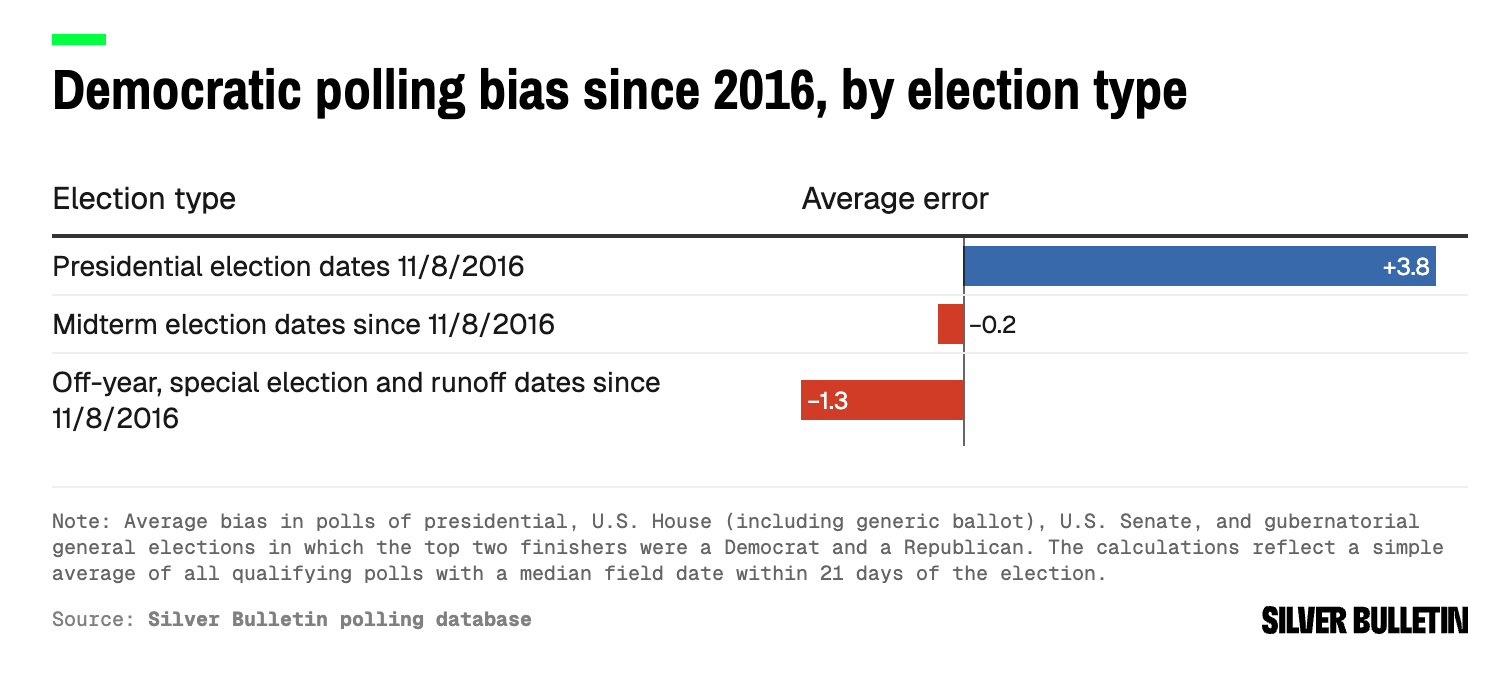
Nate Silver takes on the question hanging over another round of strong Democratic polls: What if the polls are wrong again? Recent midterms offer more reassurance than presidential elections, but just like 2016, a relatively accurate national number might mask errors in the states that actually decide control — particularly in the Midwest.
Getting the right number of Trump voters into a sample is one challenge. Getting Trump voters who resemble the ones who aren’t answering is another.
Chaz Nuttycombe’s State Navigate poll (full disclosure: I sit on State Navigate’s board) offers an example. In Iowa’s Trump +21 state Senate District 35, standard weighting puts Democratic incumbent Mike Zimmer ahead 46-43. An alternative that adds regional recalled-vote weighting puts Republican Joe Stutting ahead 47-45. The same respondents modeled differently produce a five-point shift in the margin.
Nuttycombe flags difficulty reaching rural Republicans and his concern about respondents’ reported presidential vote. Both versions still show a competitive race in a heavily Republican district, but how much of the swing is real is still an open question.


Carlos Odio does a similar exercise on Equis’s Texas Hispanic polling, turning recall vote weighting on and off. With it, James Talarico’s vote share is 64%. Without it: 69%. That’s a 10-point difference in the margin — quite a polling error if one of these methods is correct.


🛋️ Switching sides or sitting it out?
Pew’s latest survey finds that 77% of Trump’s 2024 voters currently back a Republican for the House, compared with 87% of Harris voters backing a Democrat. But only 5% of Trump voters say they’ll vote Democratic while 13% are unsure.
This suggests the Republican problem in polling right now is more consolidation than outright vote switching to the Democrats. And the question is whether these voters switch, come home, or sit out the election entirely. That’s also the same finding from our primary analyses referenced above: the main Republican problem was Republican voters who didn’t turn out, rather than switching into the other party.
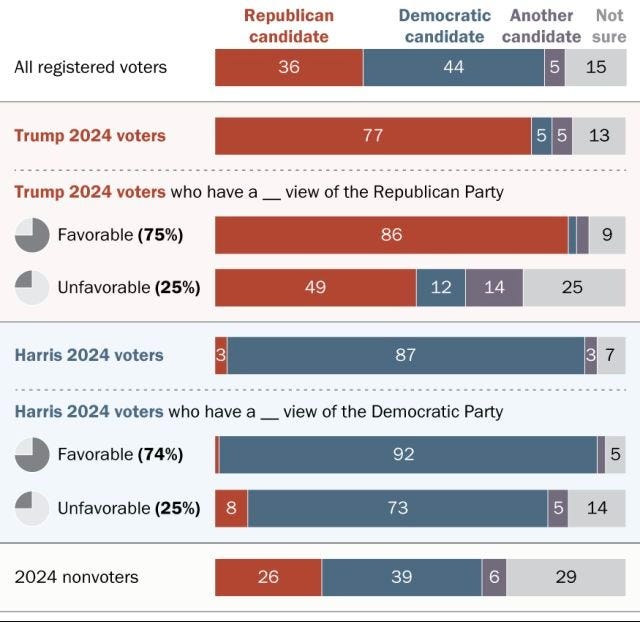
Source: Pew Research Center. Congressional vote preference among registered voters, by 2024 vote.
🎟️ Who counts as a likely voter?
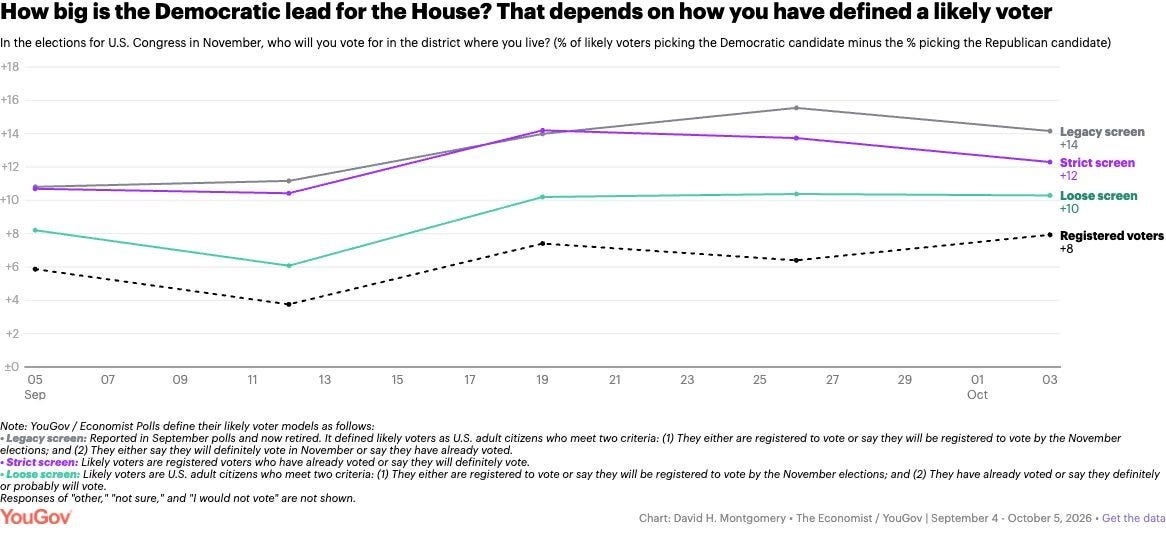
YouGov shows how much that turnout question matters. Its latest Economist survey gives Democrats an eight-point lead among registered voters, a ten-point lead under a looser likely-voter screen, and a twelve-point lead under a stricter one. The stricter definition includes registered voters who have already voted or say they definitely will; the looser version also includes probable voters and people planning to register.
YouGov has retired its previous screen, which produced a sixteen-point Democratic lead that its team said was overstated. The choice of screen alone now accounts for a two-point difference in the margin.
A founding thesis of Echelon Insights is that likely voter screens are antiquated — and were exactly the thing that overstated Republican chances in the 2012 presidential election, the cycle before we were founded. Election polls should start as likely electorate polls first, rather than trying to find a subset of a poorly defined registered voter universe. Because we have voter files, we have a pretty good sense of what likely voters actually look like. Relative motivation to vote should be looked at as a diagnostic, but only within the likely electorate universe.
🌎 The working class shifts right in Brazil
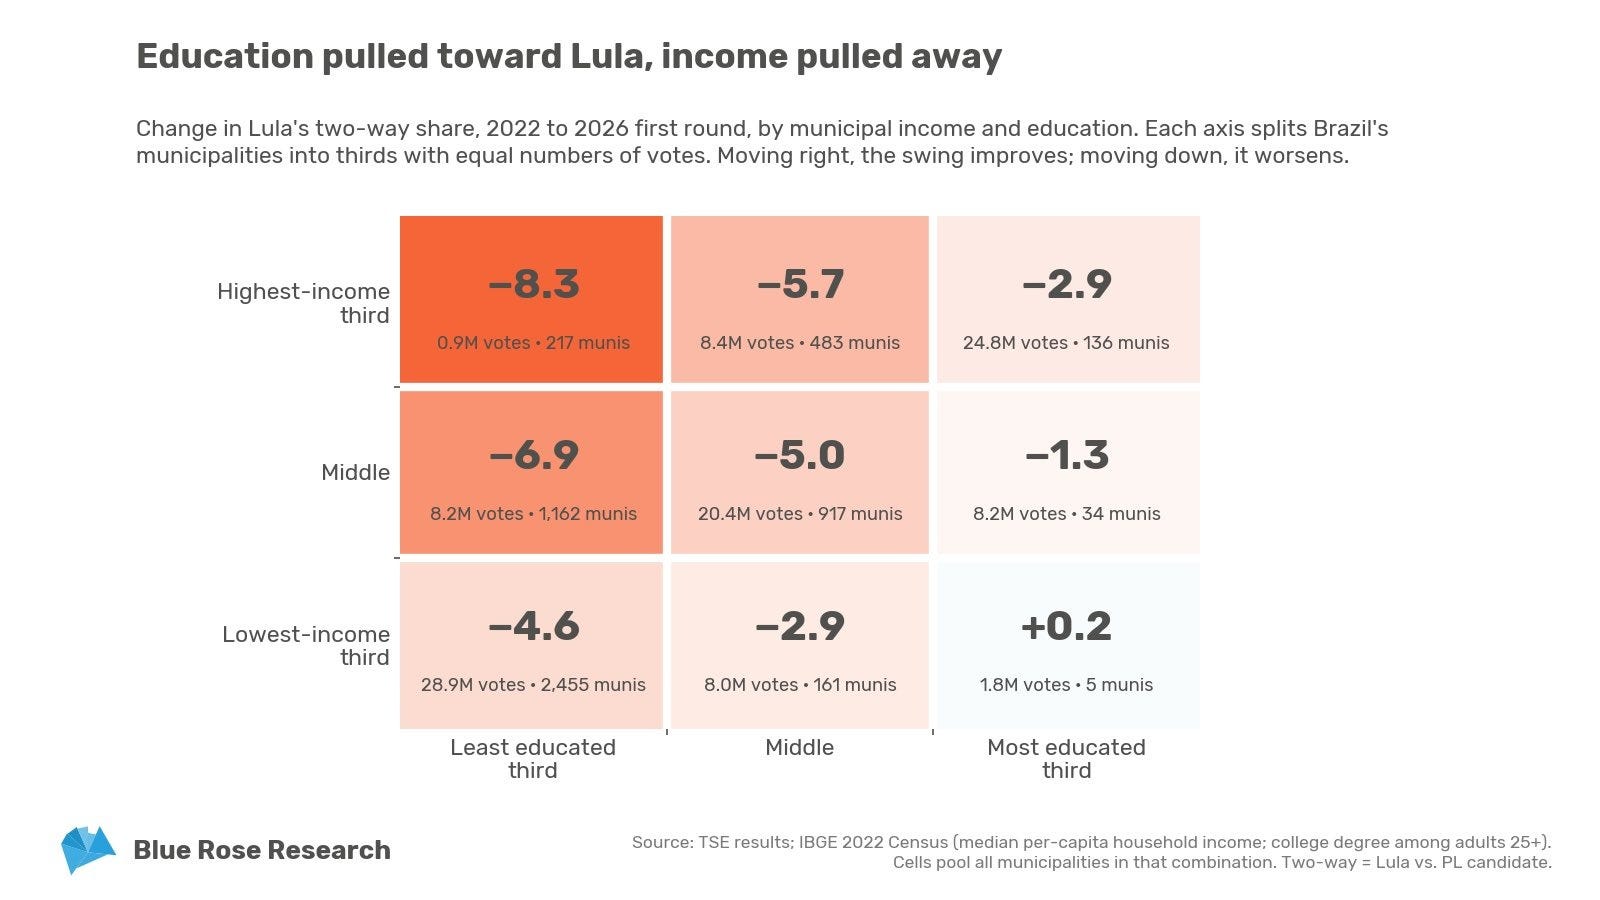
A reminder from David Shor that the Realignment is still playing out globally, with a rightward shift among working-class voters in Brazil.
⚽ AI respondents are Messi-pilled
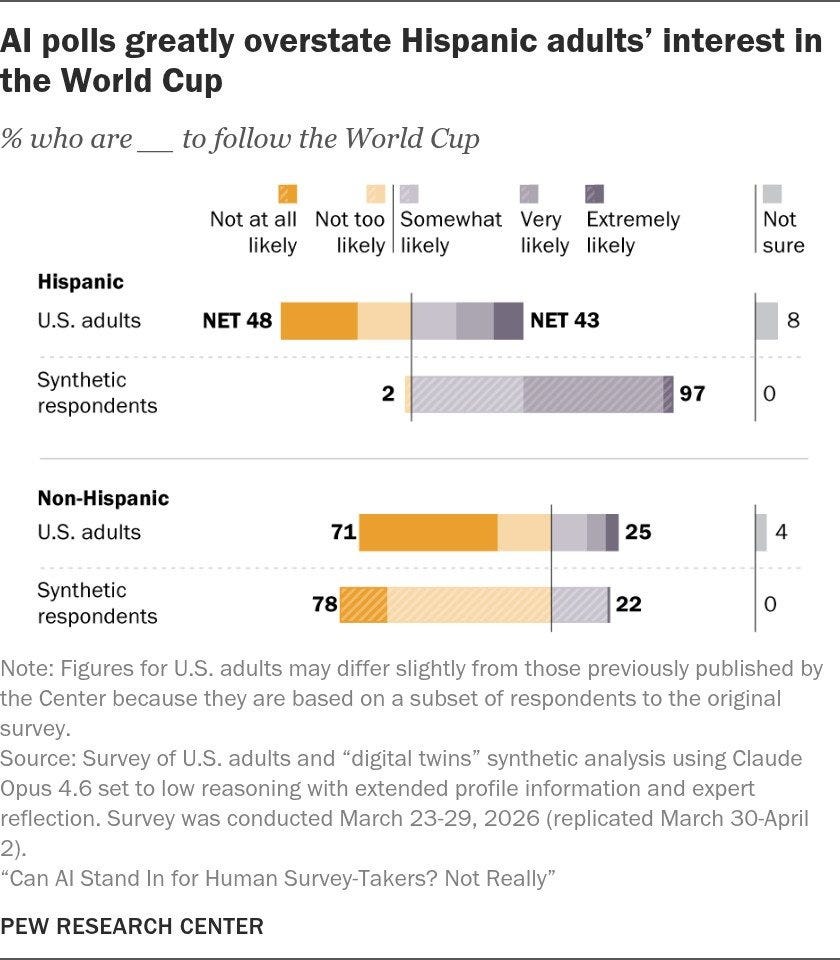
AI synthetic respondents are basically a stereotype engine and nothing more. 97% of Hispanic AI respondents said they were likely to follow the World Cup. The real number: 43%.
🗺️ How well do you know your election maps?
Play this daily Wordle-esque election game to guess the year of three election maps.