Beware of phantom state polling swings
Plus, a light critique of Nate Silver's model
I’ve been a proponent this election cycle of primarily looking at polls rather than election forecasts. The “fundamentals” seem to be essentially a dealer’s choice of each forecaster, with the most of the variations between models a function of which fundamentals the forecaster weights. Oftentimes, more of the variation within models over time is also due to shifts in the fundamentals rather than actual polls. I’m thinking here of Nate Silver’s convention bounce adjustment to the unexplained changes in FiveThirtyEight’s model between the Biden and Harris forecasts.
The fundamentals I’m primarily referring to are factors like incumbency and the economy. But there is one “fundamental” I do weight more highly: how a state should vote based on how it’s voted in the past.
This should get more weight in 2024 because this is the third successive election with Donald Trump on the ballot. While the national environment can move in whichever direction, individual states will move less relative to the country as a whole when an incumbent/previous candidate is running, so a state’s past results should get weighted heavily. The choice voters face in such an election isn’t completely a novel one. Specific regional or demographic reactions to one of the two candidates are baked in.
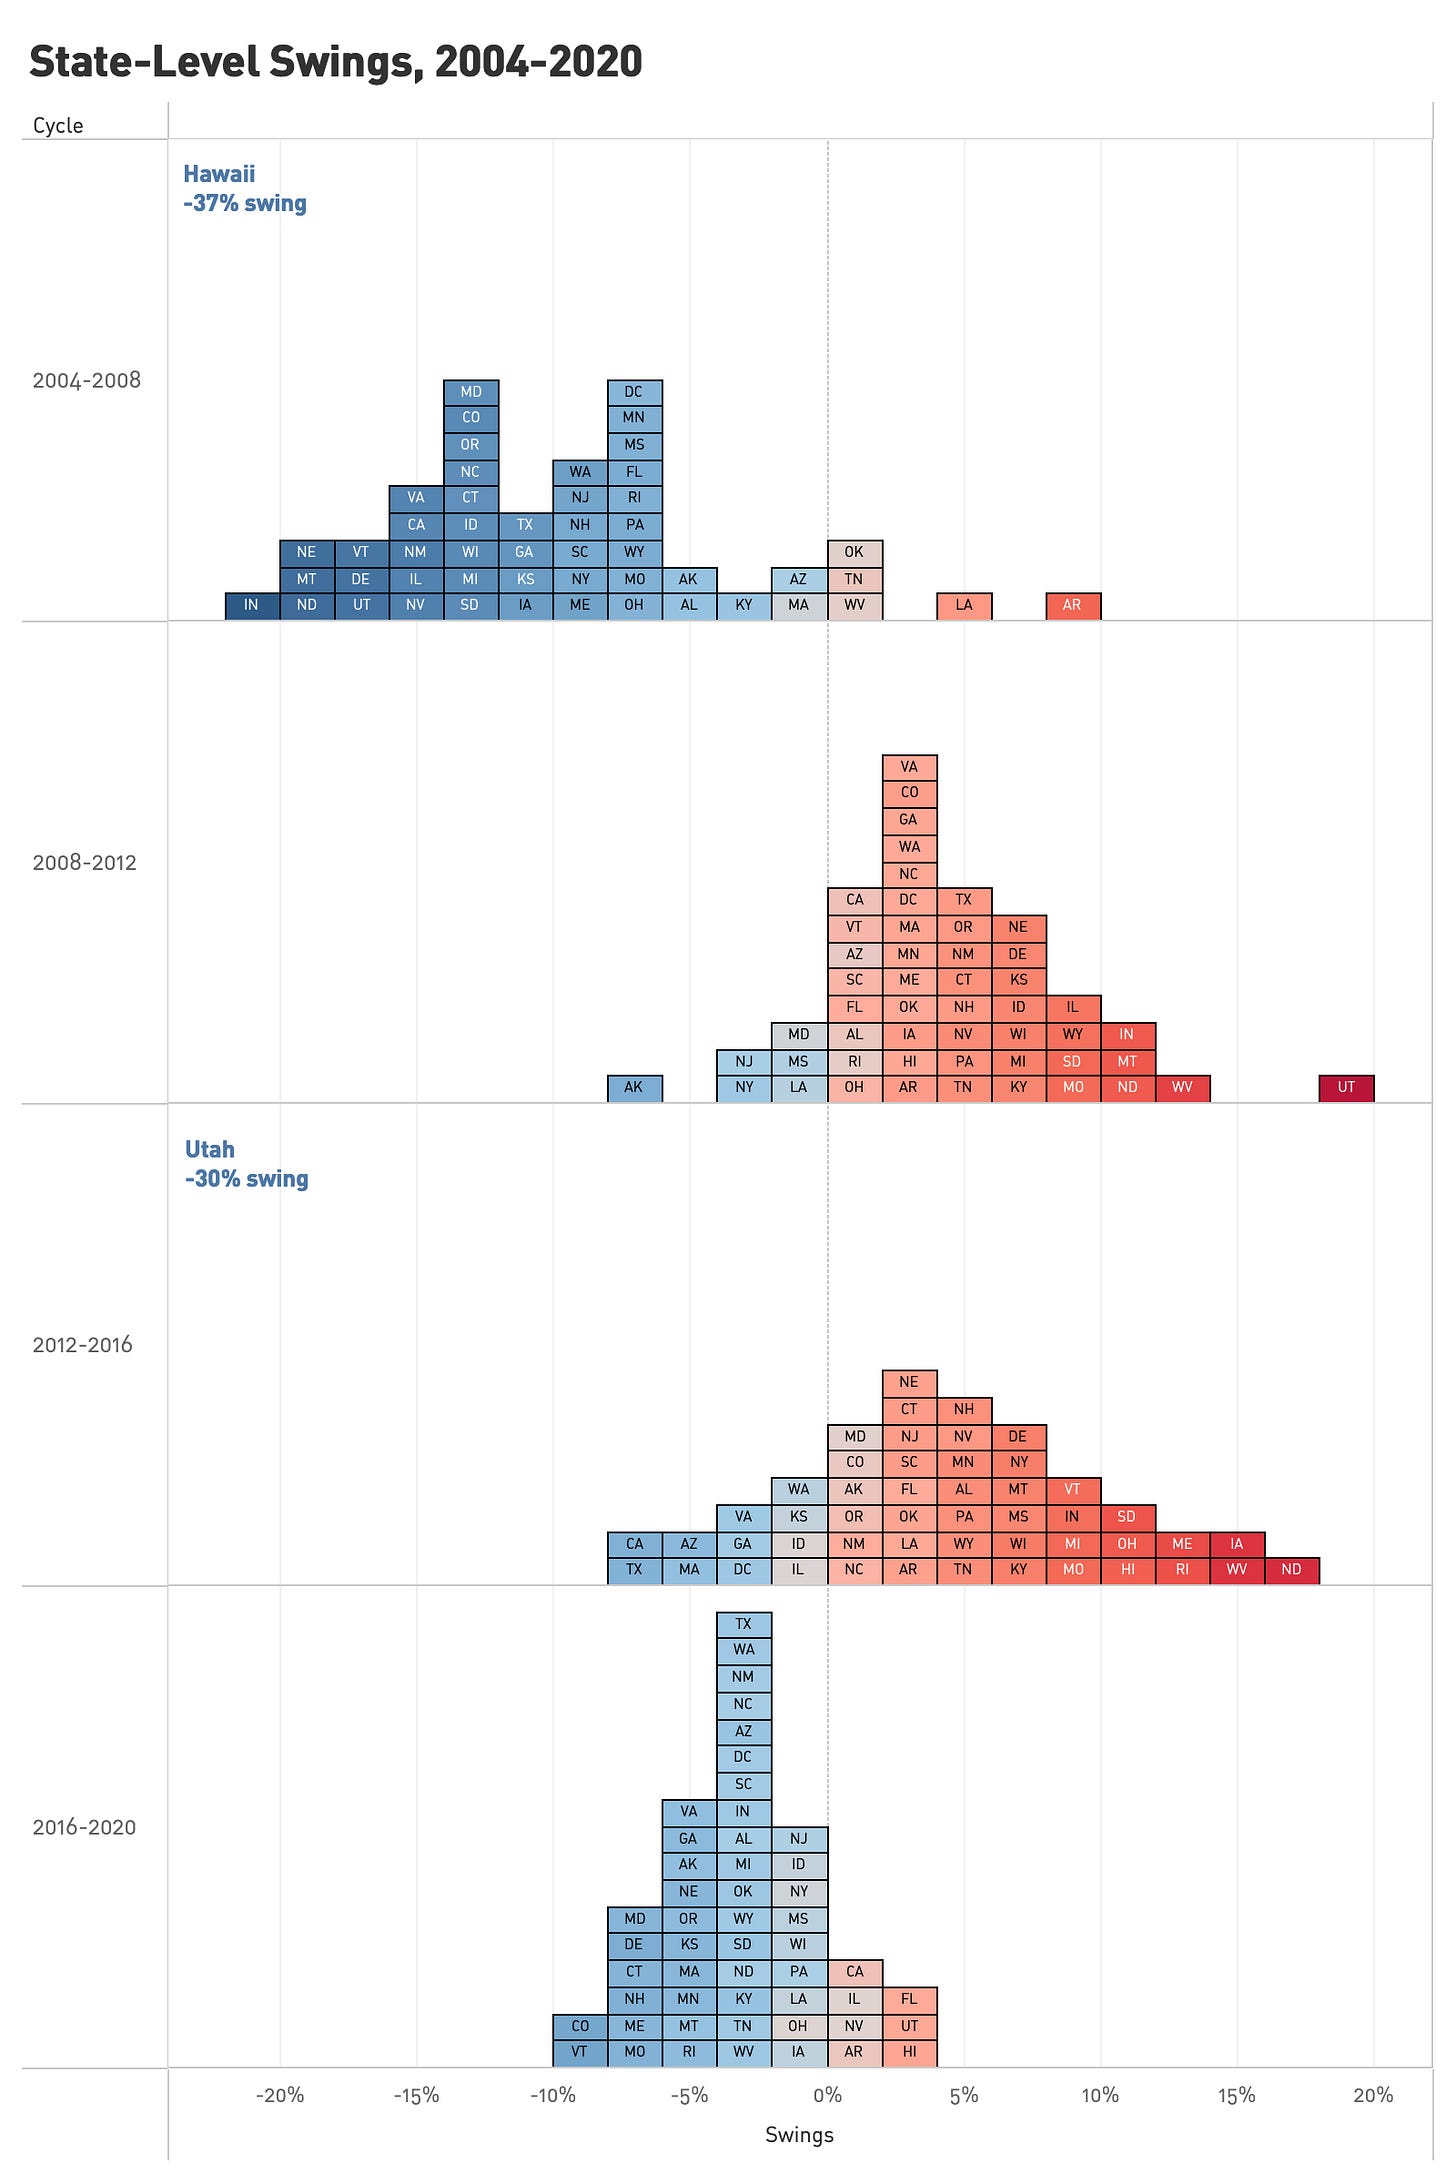
To see this in action, let’s take a look at how each state swung from 2004 to 2020:
Right off the top, you’ll notice more variation in the elections with two new candidates running than ones with incumbents running for re-election. We can quantify this just by looking at the standard deviation in state-level swings. This dropped from 0.073 in 2008 to 0.046 in 2012. And it rose again to 0.074 in 2016 before dropping even further, to 0.027 in 2020.
2024 is an unusual election with two “new” candidates who are unusually tethered to what came before—Donald Trump because he was president and Kamala Harris because she is last-minute stand-in for the current incumbent.
On this score, we should see relatively little change in the rank-ordering of states from 2020 because the choice—especially of Donald Trump—is a familiar one.
I’ve written that there’s a better chance that polling will get the entire Rust Belt right in 2024 than they did in 2016 or 2020, but I still have concerns about polling in Wisconsin, where the Silver Bulletin average has it voting 0.2 points to the right of the country while it was 3.7 points to the right of the country in 2020. That’s a shift in its lean relative to the country of 3.5 points.
Such shifts can and do happen: 11 states in 2020 shifted their lean by more than 3.5 points—but most of these are explainable based on demographics and home region effects: six of the eight states trending left by more than that amount were in the Northeast and Mid-Atlantic, while the three swinging right were Florida, Hawaii, and Utah, the latter with significant anti-Trump third parties in 2016 and the others with large nonwhite populations trending right.
If Wisconsin were alone among the major Rust Belt states in trending left, we’d want to validate that based on trends in neighboring states — like, say, if the Selzer poll today showing a 4-point race in Iowa is right. Whenever a poll shows a state behaving differently in a national race than it has before, it’s good to have a generalizable theory why that goes beyond idiosyncratic, state-specific reasons. In 2020, state shifts were explainable almost entirely based on Biden home-region and potentially religion (Catholic) effects, the nonwhite surge to Trump, and 2016 third party voting.
Given all this, how might we expect the states to shift in 2024? This brings me to a light review and critique of the Nate Silver model.


