Dem good news edition
The 538 forecast is finally back online, where Harris does better in the crosstabs, convention ratings, WA statewide primary tea leaves, trends don't continue forever
No. 327 | August 23, 2024
🇺🇲 2024
Convention week was another positive one for Kamala Harris with a lead in the average of averages of 2.4 points, up 0.7 points from last week.
Silver Bulletin: Harris +2.5 (H+0.1)
538: Harris +3.6 (H+1)
NYT Upshot: Harris +2 (H+0)
The Hill/DDHQ: Harris +3.2 (H+1.4)
RCP: Harris +1.5 (H+0.5)
Cook Political: Harris +1.0 (H+0.6)
VoteHub: Harris +2.3 (H+1.0)
RacetotheWH: Harris +3.2 (H+1.0) (NEW)
Average of the Averages: Harris +2.4 (H+0.7)
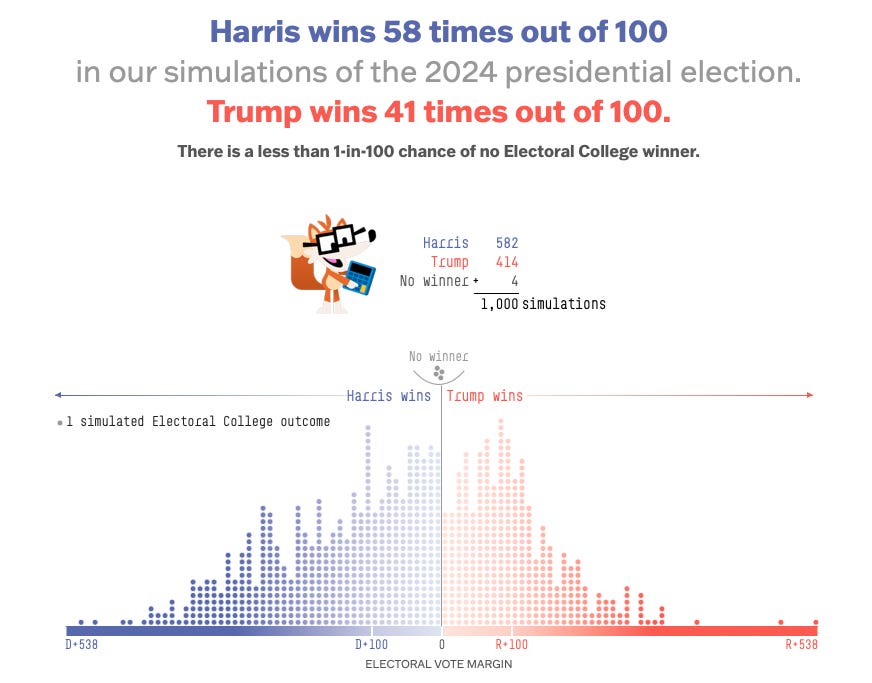
The 538 presidential forecast is finally back online. It has Harris at a 58% win probability. For those curious what changed with the switch, it picked up exactly where the Trump/Biden model left off, with Trump a narrow 53% favorite on the day Biden dropped out.
Nate Cohn sounds some skeptical notes. It sounds like what was needed to get this seamless transition from Biden to Harris was an overnight change from a 4-to-1 weight for “fundamentals” over polls to a weight of 4-to-1 in favor of the polls.
The Upshot rounds up exactly where Harris is doing better in the polls since Biden exited the race. It’s the same low-engagement groups that were disproportionately going for Trump earlier in the year.
Viewership for the Democratic convention has exceeded viewership for the RNC (and partial numbers from last night have the Harris acceptance speech at a 15 rating vs. Trump’s at 12.3). Medium Buying has the stats:
Every year, politicos read the Washington statewide primary results for tea leaves on what the national environment might be in the fall. Unlike most other states, Washington features an open primary where voters can vote for candidates of all parties. The results indicate a pro-Democratic national environment around D+3 or D+4.
Harris’ surge in the polls has people wondering if we might see a pro-Trump polling error for the third presidential cycle in a row. An anecdote from Siena College’s pollster is revealing:
Levy told me that, in 2020, the people working the phones for Siena frequently reported incidents of being yelled at by mistrustful Trump supporters. “In plain English, it was not uncommon for someone to say, ‘I’m voting for Trump—fuck you,’” and then hang up before completing the rest of the survey, he said. (So much for the “shy Trump voter” hypothesis.) In 2020, those responses weren’t counted. This time around, they are. Levy told me that including these “partials” in 2020 would have erased nearly half of Siena’s error rate.
Last week I posted about how X posting activity by partisans signaled a vibe shift. Via FWIW, the same is true of the top conservative and progressive fan pages across the major social media platforms.
CNN has a cool flow chart showing showing how open-ended polling responses about the candidates have changed from week to week in this topsy-turvy campaign season.
A reminder that trends don’t last forever and mean-reversion is a thing. Even though Georgia has trended left in recent elections, the state only has 40% likelihood of that happening again.
🗺️ Data Visualization
Where people move to from New York City varies greatly by age and income.
👫 Demographics
Another insightful data point from Dan Cox on social change: Since 1990, working class people who never attended college are far more likely to be socially disconnected, with zero close friends. (The usual caveats about the shift from phone to online polling and compositional changes in these groups apply.)