How Pennsylvania became the deciding state
Part 1 of my 2024 deep-dive into the Keystone State
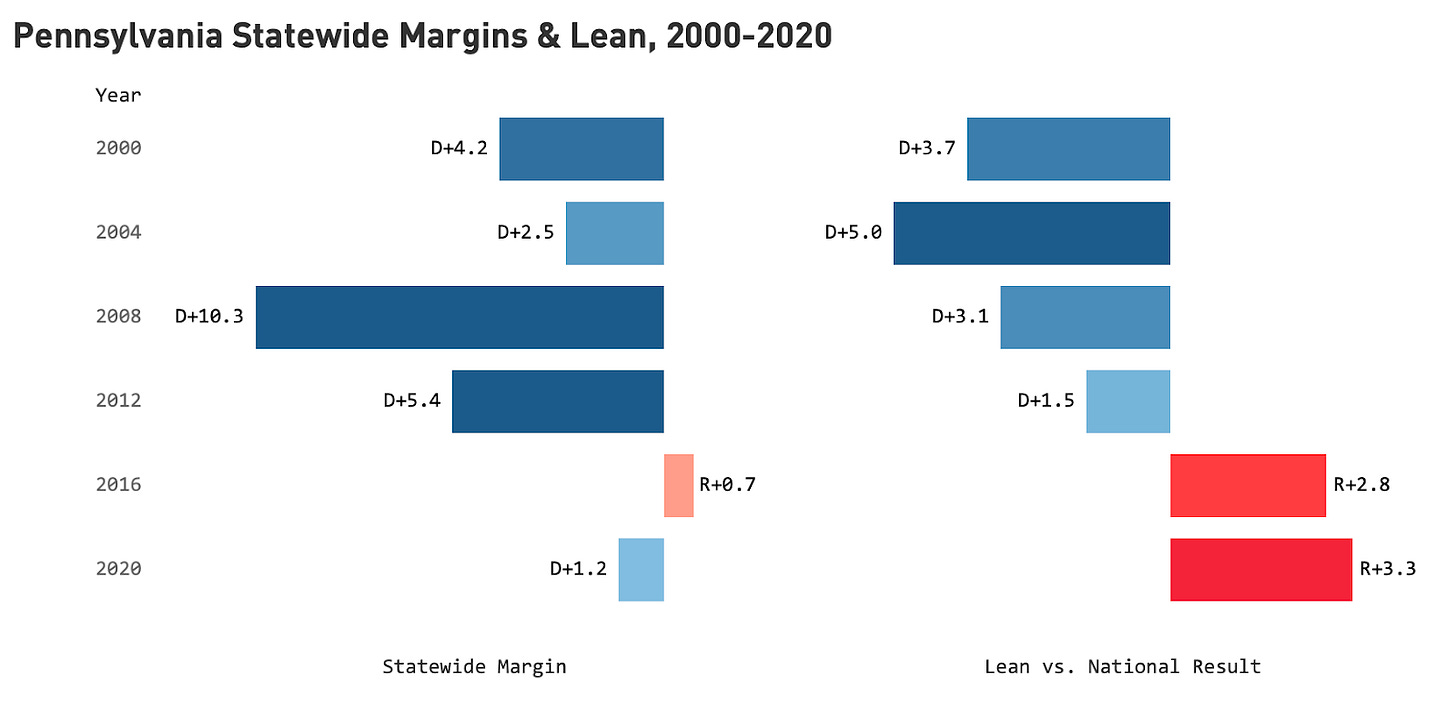
Pennsylvania has gone from a reach for Republicans to one that is arguably the linchpin of any GOP presidential majority. It was the tipping point state in Donald Trump’s victory in 2016 and slightly to the left of 2020’s tipping point, Wisconsin. The results in both years were exceedingly close: Trump went from winning the Keystone State by 0.7 points, or 44,284 votes, to losing it by 1.2 points, or 82,166 votes, four years later.
I last analyzed Georgia, where population growth in the Atlanta suburbs–particularly among Black voters—was a decisive factor in a 5-point swing left, ending up in a Biden victory. Pennsylvania, by contrast, has been the picture of demographic stability: 68% of residents are born in-state and its large metros aren’t growing more than the state as a whole. Against this backdrop of stability— some might say decline—Pennsylvania has shifted right. In the past twenty years, the state has gone from voting 4 or 5 points to the left of the country as a whole to 3 points to right.
To map out the path to victory in Georgia, I divided the state up into 10 socio-political regions, drawn at the precinct level using Redistricter. Pennsylvania I’ve divided up into 21 regions—doing more to preserve familiar regional differences. These regions are my read on the indivisible political subcultures within a state—regions have tended to move more or less as a unit before, and can be expected to do so again in 2024. More than counties, media markets, or crude urban-rural groupings, the border for these regions are drawn at the neighborhood level. Part 1 of will look at how the regions have contributed to the state’s shift right, while Part 2 will describe these regions more in detail.
The regional picture
As a state that spans the Rust Belt to the Acela Corridor, Pennsylvania’s political divide is often thought of as east vs. west. At the end of the 20th century, the urban and industrial ends of the state were unified in their Democratic loyalties, leading to the famous James Carville quip of Pennsylvania as “Philadelphia and Pittsburgh with Alabama in between.”
Carville’s one-liner is highly quotable, but a lot has changed since it was first coined. For one thing, while Philadelphia continues to be a massive driver of the Democratic vote, Pittsburgh has virtually disappeared as a net contributor to any Democratic majorities. Unlike Georgia, the state is multi-polar: not only do you have two significant metro areas, but a swath of small cities and exurbs in central Pennsylvania and the Lehigh Valley that have historically formed a Republican counterweight to the large cities and play almost as big a role as either of the major metros in state elections.
Regionally, the state is divided into 32% of the vote cast in Philadelphia and its suburbs, 25% of the vote cast in central Pennsylvania and Lehigh Valley, and 22% of the vote cast by Pittsburgh and the state’s southwestern corner. A further 15% of the state is purely rural and outside of these regions and another 5% are smaller cities like Erie, State College, and Scranton/Wilkes-Barre.
In one respect, little has changed over the last 20 years: The Philadelphia area is still a workhorse for Democrats, canceling out the GOP’s rural margins almost on its own. And when we compare the magnitude of those margins by region to what they were in 2000, Philadelphia’s influence on the Democratic side of the ledger has only increased. But the composition of those Philly margins has changed. In 2000, a majority of the Democrats’ net margins in the Philly region came from majority Black precincts, with a good chunk of the rest coming from working class whites and Latinos. The only hint of college-educated whites being a driver for Democrats came from liberals in Center City Philadelphia and the city’s northwest corner.
Today, suburban Philadelphia, virtually tied in 2000, has become a major contributor to net Democratic margins in the region and statewide. Between 2016 and 2020 alone, Democrats netted out about 90,000 more votes from the Philly suburbs alone, more than enough by itself to swing the state. Nearly half of Democrats’ margins in the Philadelphia region now come from highly-educated suburbs and liberals, compared to something closer to 15 percent in 2000. It’s no coincidence that Joe Biden chose to give his recent January 6th speech in Blue Bell, PA, one of the most prosperous of those suburbs. The contribution the Philadelphia region makes to Democratic margins statewide has marginally increased, but the “ownership” of those margins is wildly different than it was in 2000, reflecting the changing nature of the Democratic coalition increasingly tilted towards highly-educated whites.
Political punditry tends to fixate on the suburbs as the only source of swing voters, but Pennsylvania’s recent track record shows why that’s mistaken. In 2000, both the Philadelphia suburbs and the southwestern Pennsylvania rurals were virtually tied. Today, each provides a net vote margin of around 200,000 votes for the Democratic and Republican candidates, respectively. The southwest Pennsylvania rurals have turned out to be just as important as the Philly suburbs in the electoral calculus. And that doesn’t even count the red shifts in the rest of the state’s rural areas which have double- or tripled-up the swing in the suburbs.
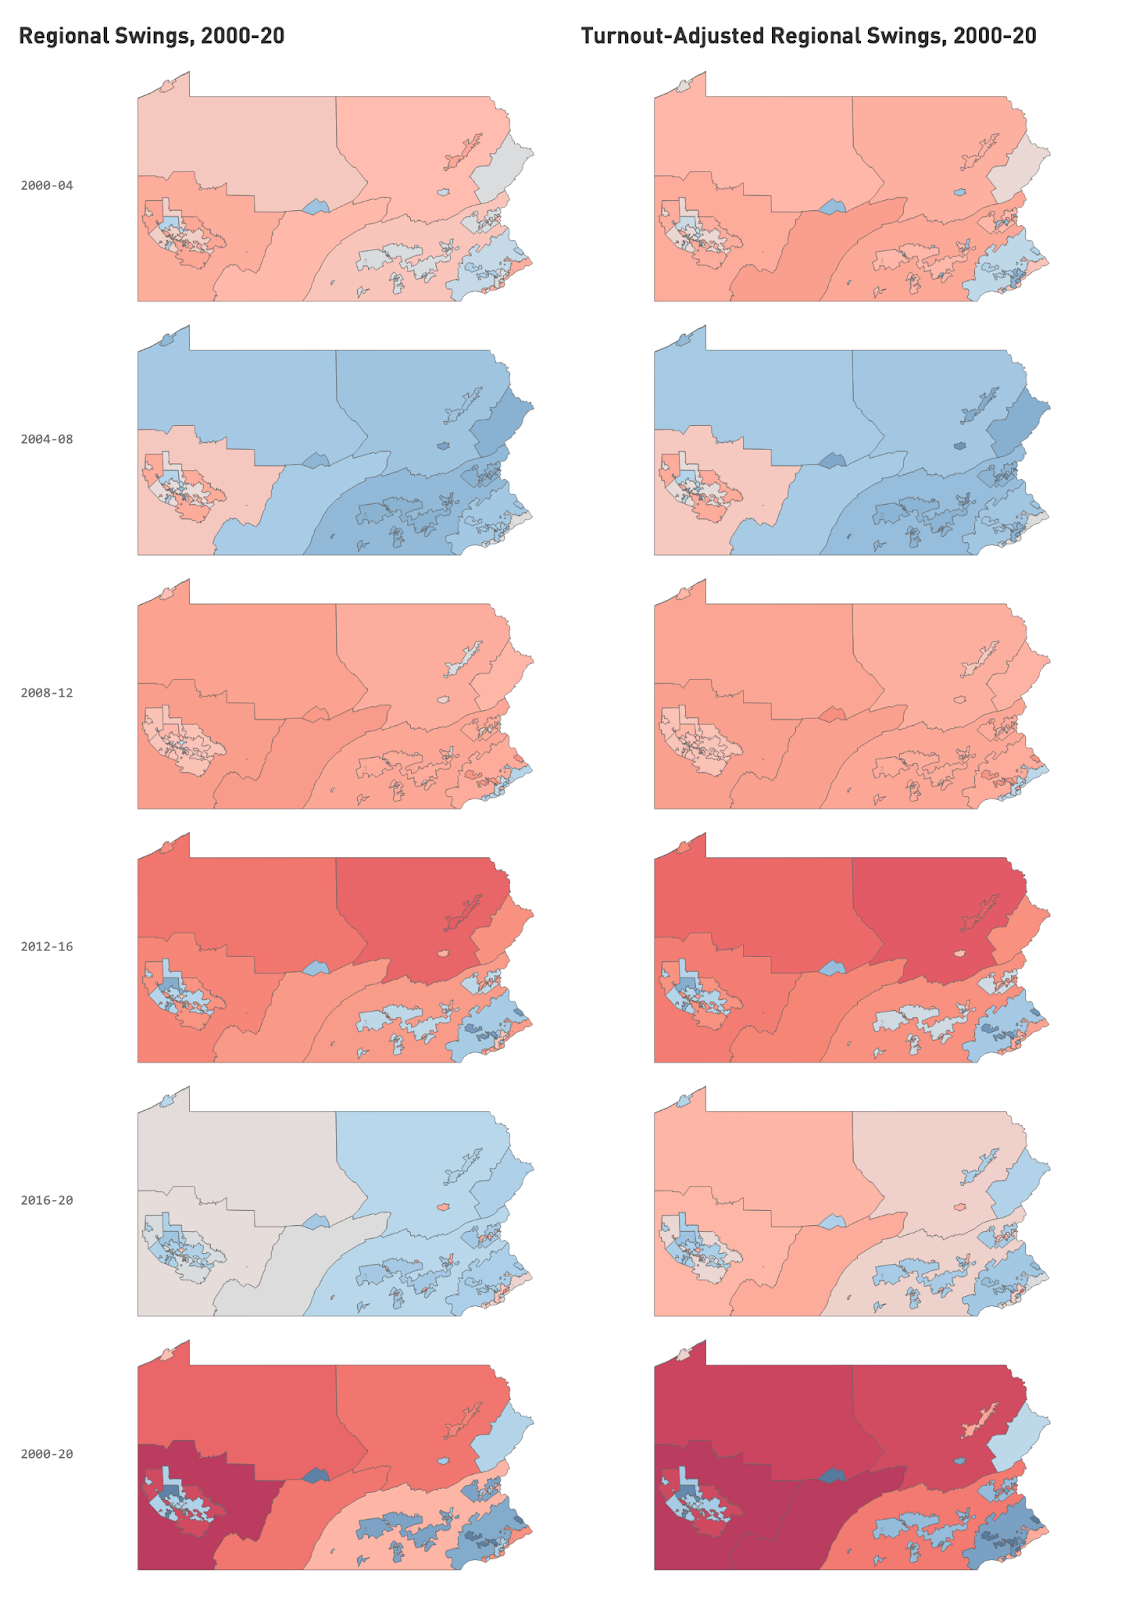
Western Pennsylvania was on the move long before Donald Trump. The Pittsburgh area swung idiosyncratically against Obama in 2008, which seemed like part of a broader Appalachian swing against him. But the anti-Obama swing extended far beyond the rural areas and well into the city’s white working class suburbs.
In 2012, most regions in the state moved off of Obama, and the state’s lean in presidential elections shifted, from D+3 or 4, to just D+1—albeit still amounting to a fairly comfortable Obama win of 5 points. This set the stage for the birth of Pennsylvania as the ultimate swing state, not just a Blue Wall prize Republicans would long for wistfully. The 2012 shifts were pretty straightforward, but seem odd in light of today’s coalitions: Romney gained votes from whites broadly, across both rural and suburban areas. Only white working class Philadelphia swung against Republicans that year. The 2012 shift laid the groundwork for Trump to win the state in 2016.
Whereas swings prior to 2016 had heavy regional signatures, 2016 was something new: education polarization that created new divisions within metro areas. White working class neighborhoods in Philadelphia and Pittsburgh swung to the right while more educated suburbs in both cities swung to the left. Elsewhere, Trump built massive margins in the rural areas, but the swing was strongest in the northeast corner (typified by large swings in Scranton/Wilkes-Barre) which had largely missed out on the pre-2016 Western and Pittsburgh-area rightward swings. (This is an underappreciated part of predicting future electoral swings: the largest ones happen where the demographic winds are at your back and which underperformed in previous cycles.)
With the exception of a gradual westward drift, and in contrast to the shift among Democrats in and around Philadelphia, ownership of where Republicans built their majorities didn’t change much. Those margins got much larger in 2016, now able to best the Philly metro in a tug of war. And the white working class Pittsburgh suburbs, in contrast to the suburbs everywhere else, flipped from Democratic to Republican — pretty much the only one of our regions switch parties decisively except for the wealthy areas around Philadelphia and Pittsburgh.
In 2020, Biden won the state on a small, sub-2 percent shift. But Pennsylvania was confirmed as a right-leaning state in the Electoral College calculus, with the state’s lean in presidential elections ticking up to R+3.3. In a national political environment shifted right from 2020, Pennsylvania should lean ever so slightly Republican.
The most notable thing about the subtle 2016-20 is the east-west divide. Western Pennsylvania stood pat or drifted slightly to the right, aside from the education-fueled suburban Pittsburgh shift left, while Biden made gains throughout the eastern half, with the exception of the multiracial populist coalition of urban working class whites, Blacks, and Latinos. This could be Biden claiming this Scranton-Wilmington axis as his home — “Scranton Joe” did do 5 points better than Clinton in Scranton proper — but a more convincing explanation is that it was an extension of a northeastern shift towards Biden outside the big cities. Biden being a Northeastern Catholic himself provided a better contrast to the brash, vulgar New Yorker than Hillary Clinton, a mere transplant to the region.

The upshot of the 2012-20 shifts is the GOP’s coalition has now shifted north and west. The GOP opened up huge vote drivers in three of the four corners of the state — southwest, northwest, and northeast — that more than counteracted the shift left in the Philly suburbs. The paid subscribers chart below, similar to the one above, shows the net vote shift between 2012-16 and 2016-20 by region. While the 2016 shifts show mostly unanswered Trump gains except in the most college-educated parts of the state, 2020 shows a more static picture, with fewer swings, but mostly unanswered Biden gains only partly offset by slightly expanded Trump margins in the rurals and Black and Latino swings in his direction.
Biden’s 2020 coalition was the result of 2012-16 polarization carried forward with a regional flavor. If you bisect the state roughly at its geographic midpoint, you get Biden gains in the east and Trump gaining or holding steady. And Biden’s gains were further reaching down the educational ladder, holding his own or better in areas with 30-40% college graduates, as opposed to the majority needed for Democratic gains in 2016. That meant some of his strongest gains came from the south/central region, historically a GOP counterweight to Philadelphia, but now more purple areas with higher population growth.
To the extent there’s a story to be told about high population growth making places bluer, it’s one that’s happening in central Pennsylvania, in exurbs around Harrisburg, York, and Lancaster. This region also happens to be home to counties that are statistically
And even then, the growth trend is modest compared to pretty much anywhere in the Sun Belt. But the region as a whole is significant in state politics, with a Republican-base South Central Countryside making up 14% of the state’s vote and the purple growth exurbs making up a further 10%. This latter group swung by 8 points towards Biden between 2016 and 2020, while the larger surrounding region swung 3.6 points, remaining solidly red. Also located primarily in this region are Latino neighborhoods in smaller cities which swung 7 points towards Trump—areas which collectively outvote the Philadelphia Latino community.
This region is a one to keep an eye on, and proof that on this, Carville was wrong: between Philadelphia and Pittsburgh is not just “Alabama,” but a third power center that’s increasingly serving as the battleground in state politics.
Paid subscribers will see exclusive charts as well as higher-resolution versions of the other charts in this piece below.


