
If you’ve ever watched a BBC election broadcast, you’ve seen its legendary Swingometer, moving the dial until one party or the other took control of Parliament. It tried to answer a simple question: given a uniform swing in the national vote, how many seats shift?
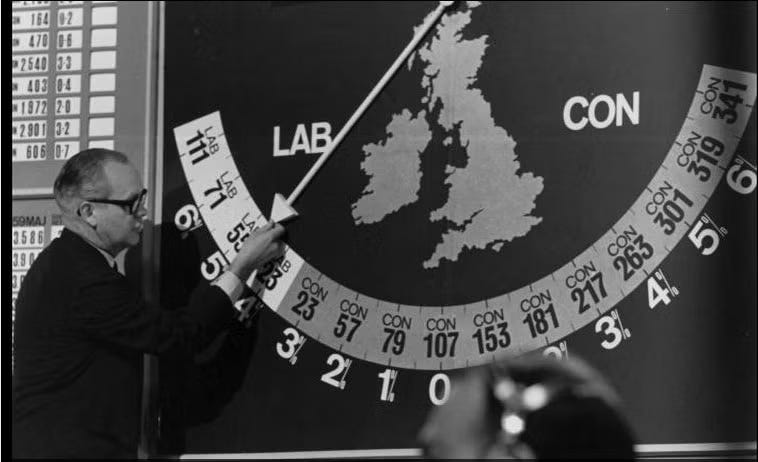
Of course, the idea of uniform swing was always too simplistic. Seats don’t swing uniformly. Demographics and candidate quality make them swing differently. We need a Swingometer that does the same. So I decided to build one.
The Intersection’s 2026 Swingometer starts with Democrats winning a 224-211 majority in the House based on today’s D+6.0 generic ballot polling average. Unlike the swingometers of old, not every seat to the left or right of the dial is the same color. Seats vary based on demonstrated track records of over- and under-performance and a few penalties added for ideological extremity or controversy.
The Swingometer starts with the 2024 presidential vote in a district and adjusts the baseline expected result accordingly before other factors are applied. A D+6 generic ballot translates to a 7.5-point shift left from the last presidential result, so the very simple version is that Republicans are only favored to win in seats won by Trump by 7.5 points or more. Now, here’s the fun part: Think the final national vote will be something different, like D+8 or D+4? You can move the dial on the interactive version and see what happens in each seat. This interactive version will also update live for the rest of the cycle with the latest generic ballot numbers.
One thing I wanted the Swingometer to clearly show is how the House battleground changed as a result of redistricting. The part of the wheel between Trump +0 and Trump +9 is much emptier because these were the kinds of seats drawn to be more safely Republican in redistricting. That’s why the tipping point for House control only happens at a D+4 generic ballot and Democrats are projected to only win a handful of seats over that. A tied national vote would leave Republicans with a 225-210 majority.
The Swingometer also factors in the recent Missouri Supreme Court decision reverting the state’s to its pre-existing lines. If this decision is overturned, the Swingometer will also adjust.
There’s only so far redistricting can go, though. At Trump +9 or more, the offensive opportunities for Democrats start to mount. If they can swing the national vote by 3 points more, 13 more seats would be expected to flip.
What are the tipping point seats?
The Swingometer shows electoral tipping points a few different ways. With randomness turned off, it expects Marcy Kaptur’s OH-9 to be the tipping point and also the reddest seat a Democrat in Congress will hold after the election. Only one Republican would survive in a Harris district, and you can guess who that is: Brian Fitzpatrick in PA-1.
The closest seat in the country is expected to be David Valadao in the redrawn CA-22, with the swingometer more bullish on him than his primary results because of his past overperformance and his drawing a progressive opponent. Other extremely close seats feature controversial candidates we’ve accounted for with 2026-specific adjustments. These include Tom Barrett, who survives in a Trump +1.3 due to his past performance and the 4-point penalty applied to his leftist challenger Will Lawrence, and Max Miller in OH-7, who squeaks by in a Trump +11.5 even with a 5-point penalty.
While I’ve made some attempt to account for past electoral performance and apply penalties for recent controversies, I don’t consider the Swingometer to be a full House forecast. And if you disagree with any of these assumptions, you’re free to change them. Just move the dial or adjust the penalties or per-race candidate quality metrics to your liking.
Some other knobs you can play with
Another setting that’s available to you, but is off by default: the Battleground Damper. In the 2022 House races and the 2024 presidential battleground, the seats and states closest to the tipping point swung less than the national average, thanks to a more vigorously contested campaign on both sides. In both 2022 and 2024, this meant a more favorable environment for Democrats in the battlegrounds than nationally (albeit still losing all seven battleground states in 2024). If the swing were reduced by half in the closest battlegrounds — defined as the 10 seats closest to the tipping point getting a 50% swing reduction, and the next 20 getting a 25% swing reduction, Democrats would eke out the narrowest 218-217 majority while still winning the popular vote by 6 points. Because this is a relatively recent phenomenon and has not been tested in favor of Republicans, this setting is turned off by default.
You can also turn the effect of incumbency off or reduce it by half. Turning it off would net Democrats one more seat in most scenarios.
Finally, random variation is turned on so that the swingometer behaves more like a probabilistic forecast, particularly near the Trump +9 cliff where the impact of randomness is not evenly distributed on both sides. Randomness helps Democrats by 1 seat at the current D+6, but if you moved the dial to D+7, it would net them 3 extra seats above a purely deterministic model, as they move closer to the large seat haul above Trump +9.


