What unlikely voters think
New Pew typology just dropped, state-level partisanship, roll your own redistricting, Fable 5, AI is generating 8 times more code for humans to sift through, a stop-the-steal chart for the NBA Finals
No. 404 | June 12, 2026
📊 Where unlikely voters differ the most from likely voters
Marquette Law School poll’s Charles Franklin has published a great summary table breaking down views on various topics between the likely, registered, and unregistered electorates.
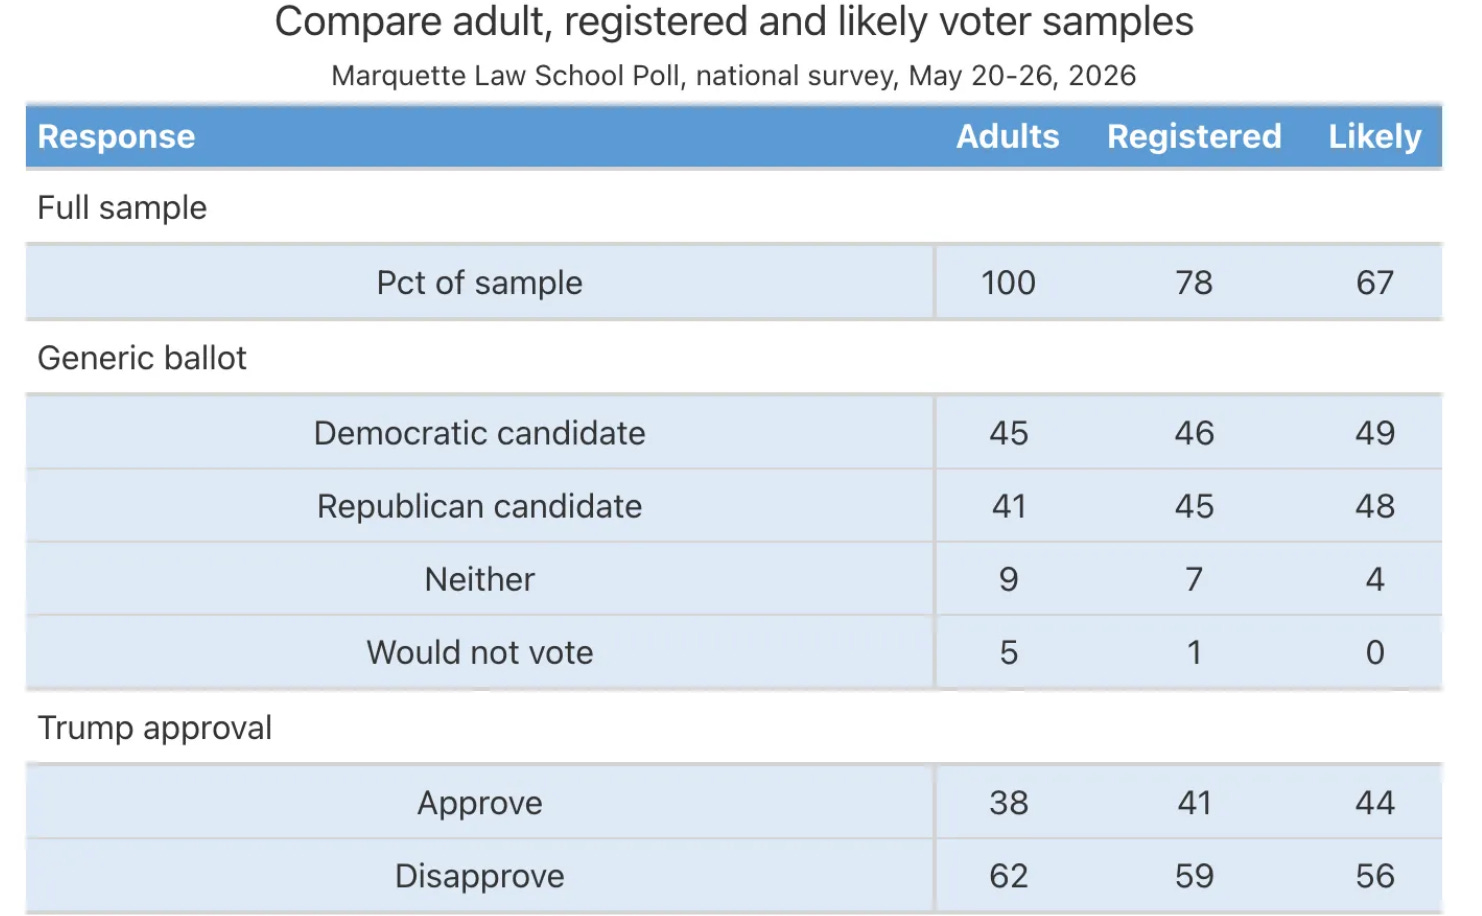
You may have heard me harp on this before: polls can look really different depending on whether you’re interviewing all adults or just likely voters. Usually, a poll of all adults will show Trump approval in the 30s while a poll of registered or likely voters is more likely than not to show it in the 40s.
What’s really interesting is not how the overall number shifts based on the inclusion of different respondents, but what these marginal groups themselves believe. So I fed this table to Claude and it had it run an imputation to find what the unlikely voter in Marquette polling thinks, be that registered but not likely voters or unregistered adults. These numbers are just estimates based on the rounded table, and may be noisy, especially for the registered but not likely universe (11% of the public). To wit, here’s the breakdown.
The less likely the voter, generally speaking, the more negative things are for Republicans, in an inversion of the pattern we saw in 2024. 44 percent of likely voters in this poll approve of the job Trump is doing; that number is in the 20s for unlikely or non-voters. We can further generalize that unlikely voters really haven’t liked the incumbents the last couple of go-arounds.
Probably the biggest divergence is on the right direction / wrong track question. Unlikely voters are less than half as likely as likely voters to say things are going in the right direction, and the wrong track number is an estimated 83 percent.
But differences are actually more muted on evaluations of the parties, which don’t differ at all for Democrats in Congress and are more modest for their Republican counterparts. Unlikely voters tend to generally dislike both parties more, but with a sharper gradient for incumbent Republicans.
These differences aren’t as sharp as those for a nonpartisan measure like the right direction / wrong track. Wrong track sentiment doesn’t automatically translate to partisan anti-Republican sentiment — but enough of it does to make a difference in the midterms. Trump approval sits somewhere in the middle — half partisan sentiment, half proxy for wrong track sentiment. Unlikely voters, almost by definition, are much less partisan than likely voters. That makes donning a red or blue jersey a higher hurdle for them than thinking things are off on the wrong track and blaming whoever is in power for it.
Unlikely voters are also quite different in their issue prioritization: less likely to say the war in Iran is their top issue, and more likely to say the economy.
Public opinion has a defined shape and structure. Whatever the direction of public opinion is at any given point, it tends to be more exaggerated among less engaged voters. And those of them who do enter the midterm electorate are disproportionately likely to be independent or swing voters.
📊 New Pew typology just dropped
Pew Research Center’s updated Political Typology quiz categorizes Americans into nine political groups based on their views and values. Here’s their write-up of the results.
Echelon’s 2026 Political Tribes will be coming out in the next few weeks, but Pew’s work aligns with ours in many ways. They find that short of half of each political coalition belongs to an extremely ideological tribe and 15 percent of each coalition is the “wrong” party based on their views on issues — showing an underlying complexity we don’t normally see in most public opinion research. They further divide the most ideological tribes (Loyal Liberals and Leftward Progressives for Democrats, and the No Apologies Right and Family First Conservatives for Republicans) but find a similar shape to less attached partisans. Their Pragmatic and Polite Right maps to our Moderate Right and their Order and Opportunity Left maps to our American Institutionalists.
🗳️ How each state is swinging in 2026
The Argument models how each state would vote if an election were held today. The analysis points to a substantially more Democratic political environment than 2024, with several Republican-leaning states becoming highly competitive.
🗺 Roll your own redistricting
Christopher Kenny has built an Algorithmic Redistricting Atlas that maps how redistricting impacts past and present cycles, letting you tweak the national environment and your preferred redistricting strategy.
🤖 Another leap forward for AI
Claude Fable 5 is out. This is a version of the Mythos model with additional safeguards for cyber and biosecurity. I expect the number of vibe-coded projects I write up in this newsletter will continue to grow at an even faster clip.
AI is replacing human coding, but is also generating lots more code that humans (at least as of now) will need to review. Internally at Anthropic, Mythos is generating 8 times more code than the pre-Claude Code baseline. So, don’t count on there being a jobs apocalypse just yet.
Here are just a few of things people have been cooking up with the new model. Ethan Mollick used it to build an interactive isochronic travel map showing travel times from New York to destinations worldwide, all from a single high-level prompt.
And Nicolas Bustamante asked it to create an interactive map of San Francisco using transit, terrain, and weather data.


