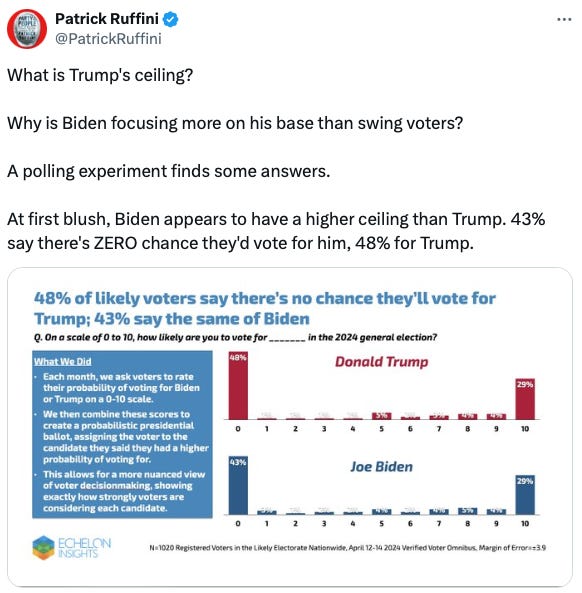
Why Biden is playing to his base
The enthusiasm gap, 2016 all over again, pendulum counties, districts from 2008 to 2020, the Hispanic working class, Democrats and men, clustering Congress, 10 years of The Upshot
No. 313 | May 3, 2024
📊 2024: The Polls
Monica Potts: Voters Don't Like Biden's Economy -- but Why? (538)
“Americans have been sour on the economy since President Joe Biden was sworn into office. As we head into an election season that is likely to be a 2020 rematch between Biden and former President Donald Trump, voters give Republicans and Trump an edge on economic issues. An April 12-14 poll from Echelon Insights found that 57 percent of all voters somewhat or strongly disapproved of the way Biden is handling the economy, and favored Trump on making the economy work better by 48 percent to 40 percent. That's only a recent example of what surveys have routinely shown: Voters aren't happy with Biden's handling of the economy.
But what exactly are voters disapproving of? What do they mean when they talk about the economy? Therein lies a disconnect between most economic indicators that economists consider — things like GDP, the unemployment rate, job growth and inflation — which are all looking up, and how voters feel. When voters measure economic well-being, they're much more likely to use more personal metrics, such as how easily their family can meet their basic needs. That can be more of a feeling than an exact calculation, and right now, the Biden reelection campaign is battling the general sense that everything has gotten a little bit worse.”
Nate Moore: Will the Enthusiasm Gap Matter in 2024? (The Liberal Patriot)
“Just 39 percent of voters are enthusiastic about the impending rematch between Joe Biden and Donald Trump. The lack of excitement is no surprise: both men are deeply unpopular.
What is surprising, however, is the large partisan enthusiasm gap. According to fresh polling from Monmouth, 63 percent of Republicans are ‘very’ or ‘somewhat’ enthusiastic about the election, compared to just 36 percent of Democrats. This 27-point gap places Democratic enthusiasm closer to that of independents—a group that usually slots in significantly below firmer partisans.
This reluctance extends across key components of the Democratic coalition. Younger voters are less enthusiastic than those 55+ and non-white voters are less enthusiastic than white non-college voters—both findings reflected in polling that shows deflated Democratic margins with these groups.”
Ruy Teixeira: Could it Be 2016 All Over Again? (The Liberal Patriot)
“Two things are clear about the 2024 campaign at this point. One is that Biden is still trailing Trump: he’s behind nationally in both the RCP and 538 running averages, as well as in every single swing state. The other is that his two great vulnerabilities are the economy/inflation and immigration, generally the two most important issues to voters. Indeed the latter now sometimes eclipses the former in importance as it has in the Gallup poll for the last three months.
Immigration was very important in the 2016 election as well. One way David Shor frequently illustrated the dynamic in 2016 relative to 2012 was with a simple two by two table illustrating that the big swing toward Trump in 2016 was among voters who both (1) supported universal health insurance and (2) opposed ‘amnesty’ for illegal immigrants. Put simply, Obama did way better than Hillary Clinton among voters who were both populist/progressive on health care and conservative-leaning on immigration.”
🗳️ 2024: The Battlegrounds
Max McCall: The Pendulum Counties (Split Ticket)
“Joe Biden won the 2020 presidential election with a margin quite similar to that of the 2012 reelection of his predecessor Barack Obama — 4.5% and 3.9%, respectively. However, his coalition differed from Obama’s, having been the product of nearly a decade of electoral change. Many counties moved in one direction — for example, most white, rural, working class counties moved sharply to the right and did not see a significant rebound in 2020. Some moved in a different direction in 2020 than they did in 2016, but only by a point or two, leaving their broader trends unclouded.
However, there are exceptions to every rule. Some counties shifted substantially in one direction in 2016, only to reverse course in 2020. These counties may still have moved significantly relative to 2012, with one cycle’s shift being appreciably greater than the other’s. Others featured swings have more or less canceled out, leaving counties right where they were in 2012 despite the political shifts of the intervening eight years. What these politically fickle counties do this November may end up determining control of the presidency.”
J. Miles Coleman: Districts of Change, Part One: How all 435 Congressional Districts Voted from 2008 - 2020 (The Center for Politics)
“One of the best tools we’ve had to analyze elections at the Crystal Ball over the years has been Dave’s Redistricting App (DRA). The premise of this open-source program, which has been around in some form or another for the better part of two decades by this point, is that users can ‘do their own redistricting.’ Towards this end, DRA provides precinct-level election and demographic data.
A couple of weeks ago, to the delight of all of us who use the program, DRA announced that for most states, it now includes presidential data for each cycle since 2008 for all of the nation’s current congressional districts. So naturally, we jumped in feet first. What follows is the first of a multi-part series that is based on DRA’s data.
To begin, we are looking at how things have changed since 2008, the earliest presidential election for which DRA has comprehensive data.
Map 1 considers the swing between the 2008 and 2020 elections using the current district lines. In blue districts, Joe Biden’s margins were better than Barack Obama’s, while the opposite was the case in the red districts.”
🤝 2024: The Coalitions
Ruy Teixeira: Postcard from the Hispanic Working Class (The Liberal Patriot)
“It’s been widely noted that Biden has been running poorly among Hispanics compared to 2020 when he carried this demographic by 23 points (which itself was a 16-point drop from Clinton’s 39-point margin over Trump among these voters in 2016). In the most recent New York Times/Siena poll, Biden’s margin over Trump among Latinos is a slim 9 points. That is close to Biden’s average Hispanic lead in polls since the beginning of the year.
I’ve been curious about the role of Hispanic working-class (noncollege) voters in driving this trend. An underreported aspect of the Hispanic shift toward Trump in 2020 was how heavily it was concentrated among working-class voters. In the Catalist data, there was a 19-point margin shift toward Trump among working-class voters but just 9 points among college-educated Hispanics. For the first time, Democrats did better overall among college Hispanics than among working-class Hispanics—a reverse class gap. Are these trends continuing in this campaign cycle?”
Daniel Cox: Have Democrats Given Up on Men? (American Storylines)
“In a recent interview with New York Times columnist Maureen Dowd, Democratic tactician James Carville lamented his party’s refusal to appeal to male voters:
If you listen to Democratic elites—NPR is my go-to place for that—the whole talk is about how women, and women of color, are going to decide this election. I’m like: ‘Well, 48 percent of the people that vote are males. Do you mind if they have some consideration?’
Not everyone appreciated the sentiment. In an op-ed for The Hill, Anna Greenberg responded that the party was right to focus on women. She wrote, ‘Carville may not like it, but the Democratic Party is the women’s party. Sixty percent of self-identified Democrats are women.’ ”
🔵 2024: The Democrats
J. Miles Coleman: Where Biden's Primary Showing Was (And Wasn't) Especially Strong (The Center for Politics)
“Last week, we considered Donald Trump’s performance in the Republican primary. Of course, Trump ended up dominating what was initially a crowded field and has been the presumptive nominee for more than a month. But when we went into the weeds in each state and looked at where his 2024 coalition was especially strong (or weak), some familiar patterns were present. Generally speaking, while Trump’s hold on rural America remains strong, there are clearly some signs that he’s continuing to struggle in many suburban counties.
So, for this week, we are doing something of a follow-up article and shifting our focus to the Democratic side. If the Republican primary was a lopsided affair this cycle, the Democratic primary has been even more of a cut-and-dry event: except for American Samoa’s caucus—where entrepreneur Jason Palmer, a former student of the Center’s Director, Larry Sabato, pulled an upset—President Biden has handily won each contest this year. That said, there has been a considerable amount of media interest in the ‘protest’ vote against Biden, specifically over his foreign policy, in the context of several state contests, notably Michigan and Minnesota (we’ll get to those later).”
🗣️ Public Opinion
Monica Anderson: Americans' View of Technology Companies (Pew Research Center)
“Most Americans are wary of social media’s role in politics and its overall impact on the country, and these concerns are ticking up among Democrats, according to a new Pew Research Center survey of U.S. adults. Still, Republicans stand out on several measures, with majorities believing major technology companies are biased toward liberals.
Our survey asked Americans about three key areas: Social media’s impact on politics and the country | Political censorship and bias in Big Tech| Government regulation of technology companies.
Since 2020, more Americans – particularly Democrats – believe social media companies wield too much political power. Roughly eight-in-ten Americans (78%) say these companies have too much power and influence in politics today, according to a new Pew Research Center survey of 10,133 U.S. adults conducted Feb. 7-11, 2024. This is up from 72% in 2020.
Another 16% say these sites have the right amount of political influence, while only 4% think they don’t have enough power.”
Nate Silver: For Most People, Politics is About Fitting In (Silver Bulletin)
“How do people formulate their political beliefs? By which I mean: how do they decide what politically-salient facts they believe to be true and which causes they identify with?
This seems like an incredibly important question if you’re trying to understand and project the course of public opinion (and even more important if you’re seeking to shape public opinion). And yet, I rarely see these sort of epistemological questions discussed among people who cover politics for a living. When I do, I think their theories are often naive, overstating the degree to which people consider political events literally on the merits — as opposed to evaluating them through a variety of psychological, social and strategic lenses.”
📰 Data Journalism
“Some say Congress is a lot like high school — but who lawmakers vote with isn't necessarily who they sit with in the cafeteria. We were interested in whether members’ formal ideological caucus affiliations matched up with how they actually voted. Is every member of the Problem Solvers Caucus actually voting to advance bipartisan legislation? (Spoiler alert: No.) Do members of the moderate Blue Dog Coalition actually break with their party to side more often with Republicans? (Spoiler alert: Yes.)
A new 538 analysis of voting data reveals that while many members’ formal caucus affiliations matched up pretty well with their voting behaviors, some did not. We analyzed every House floor vote from the first year of the 118th Congress (2023) and applied an algorithm to divide representatives into eight clusters based on similarities in their voting records, using eight official ideological congressional caucuses as a comparison. We then dug into what these clusters say about which issues and votes set members apart, and how these divides fell along the lines of ideology, tenure, district partisanship and more. (See the methodology below for more details.)”
The Upshot Staff: 10 Years, 100 Stories: The Work That defines the Upshot (The New York Times)
“Ten years ago this week, The New York Times introduced the Upshot, a section devoted to explaining ‘politics, policy and everyday life.’ That’s a wide scope, by design. As a result, more than 5,000 articles later, the Upshot has been many things to many readers.
It’s a place for clear, explanatory writing, on topics like Medicare budget mysteries, Covid school closures and the transformation of American cities.
It’s a destination for political analysis, including Nate Cohn’s newsletter, detailed election maps and the Needle on election night.
And it’s a home for data visualization and interactive journalism, where you might learn how ChatGPT works, find the best strategies for Wordle and ‘Wheel of Fortune,’ or draw your own neighborhood boundaries.”