


No. 424 | November 12, 2026
👥 Where are the young Republicans?
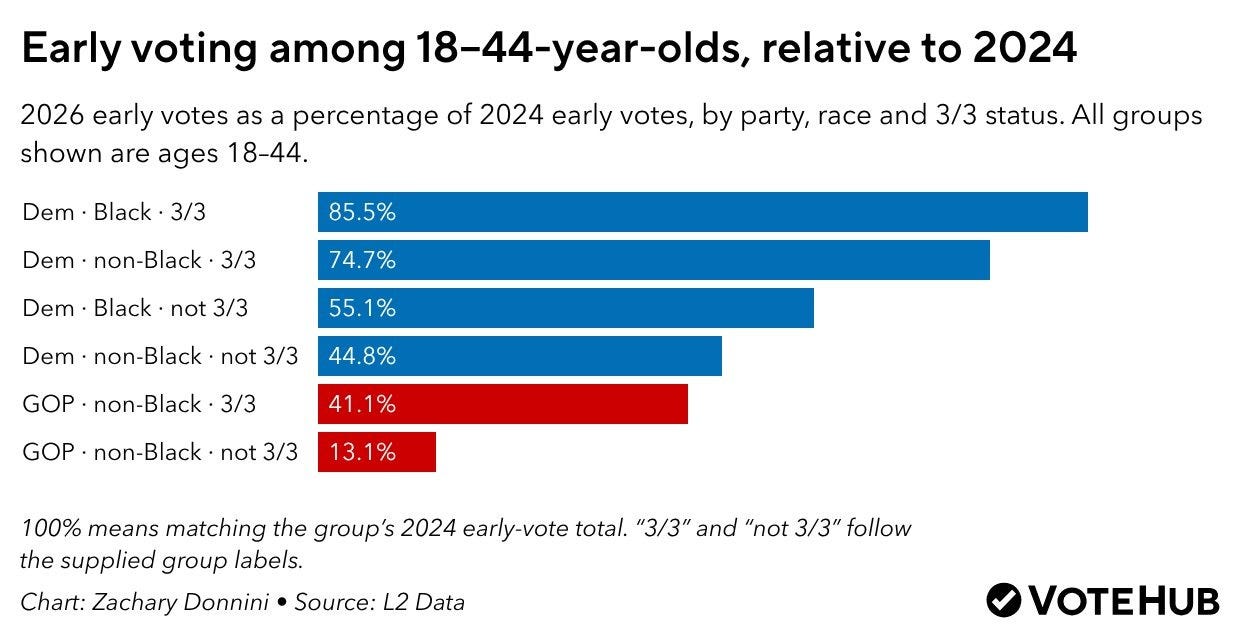
This election saw a strong lack of Gen Z and Millennial Republicans at the polls, who were on pace to turn out a fraction of their 2024 early voting rate. When turnout goes up in a group, young voters are most likely leading the pack. When it falls, they drop off the most. There’s a clear reason for this: as less habitual voters, they’re more susceptible to switch between voting or not voting. Changes in vote motivation move young voters the most.
The turnout gap was massive. Across the Senate battlegrounds, Harris-voting counties turned out at much higher rates than Trump voting counties. Only in Florida was partisan turnout remotely competitive and that’s virtually the only battleground where Republicans statewide hung on.

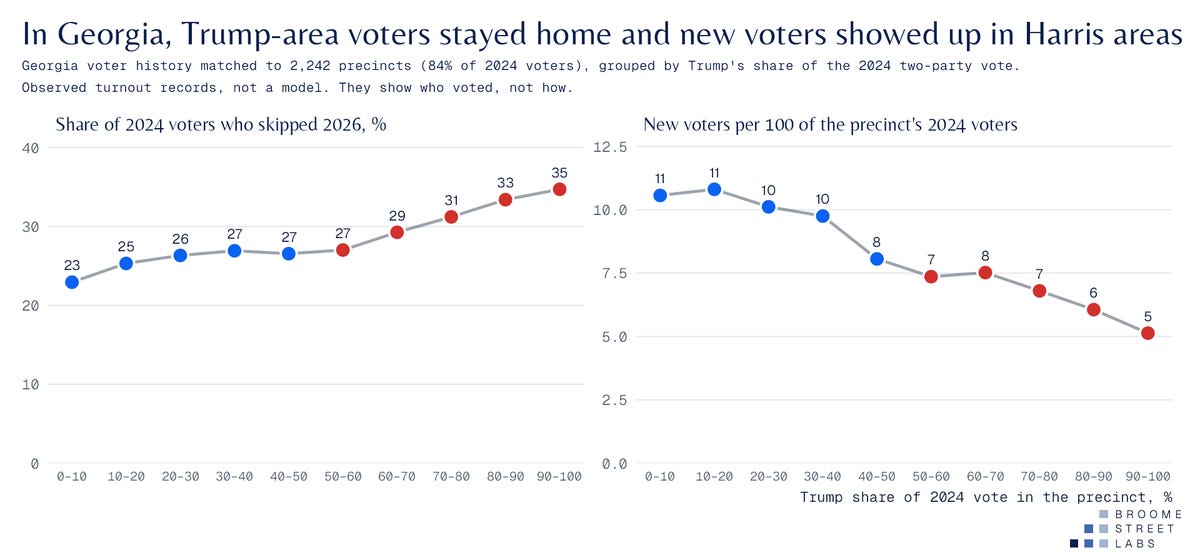
Lenny Bronner’s Georgia voter-file analysis adds evidence beyond early voting. About a third of 2024 voters in heavily Trump precincts sat out, compared with a quarter in overwhelmingly Harris precincts. Another 420,000 people who skipped 2024 voted this year, disproportionately in Democratic areas. Bronner estimates that switching still accounted for roughly 40% of Democrats’ Georgia gains, though that depends on assumptions about how the new voters voted.
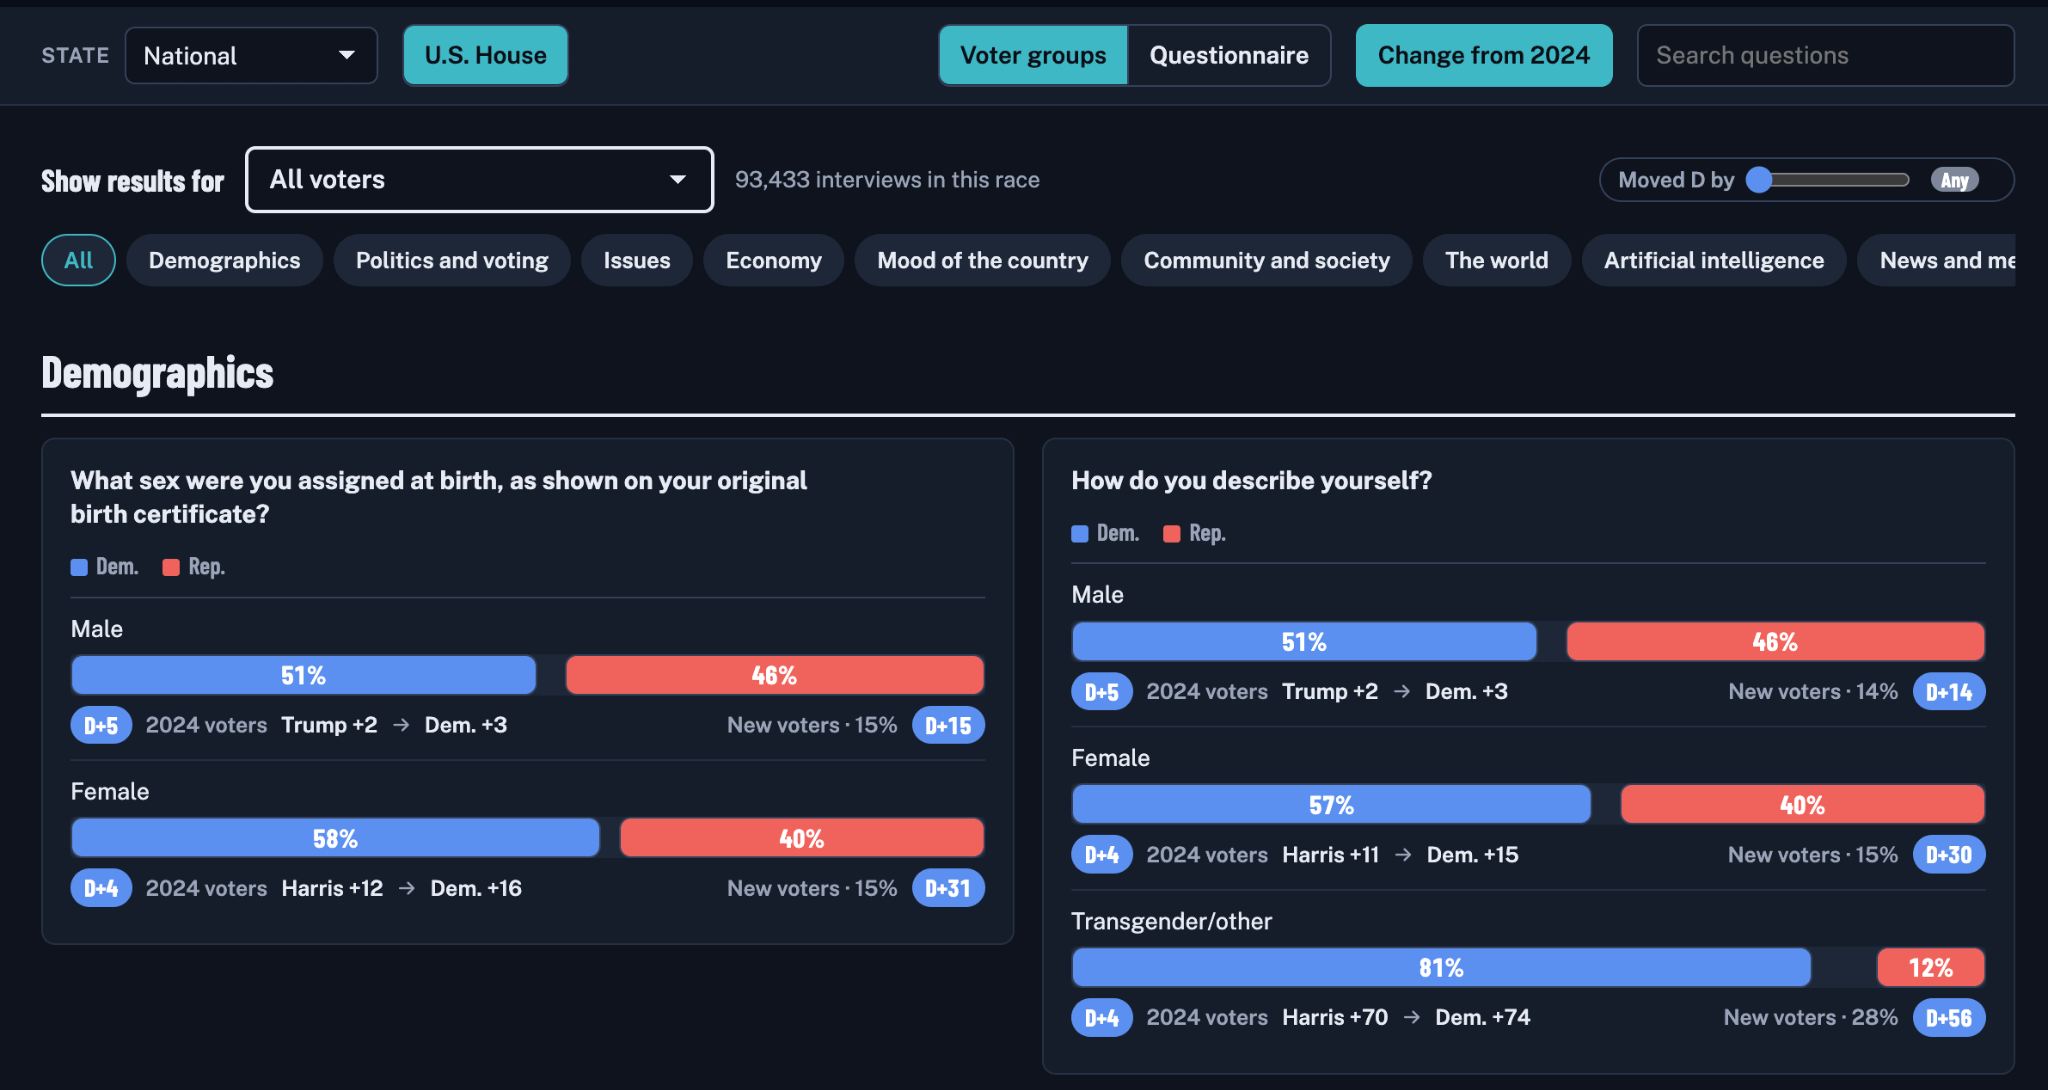
By some measures the gap between Trump and Harris stands at around ten points in voter turnout, while other metrics I’ve posted suggest closer to 20. That’s because a fuller county-level metric also must include new voters, which I estimate added around 3 points to the Democratic House margin nationally.
To do this, I looked at the NORC voter poll data and broke down the reported shift among 2024 presidential voters (adjusted using Chaz Nuttycombe’s recall bias work), the margins among new voters, and what this said about which 2024 voters dropped out of the electorate. In the House, around 40 percent was due to vote switching, 40 percent due to turnout, and 20 percent due to the contribution of new voters. Together, turnout-related factors account for around 60 percent of the shift. You can see this in the exit poll-like dashboard I built to explore the data, including a “turnout or switching?” view.
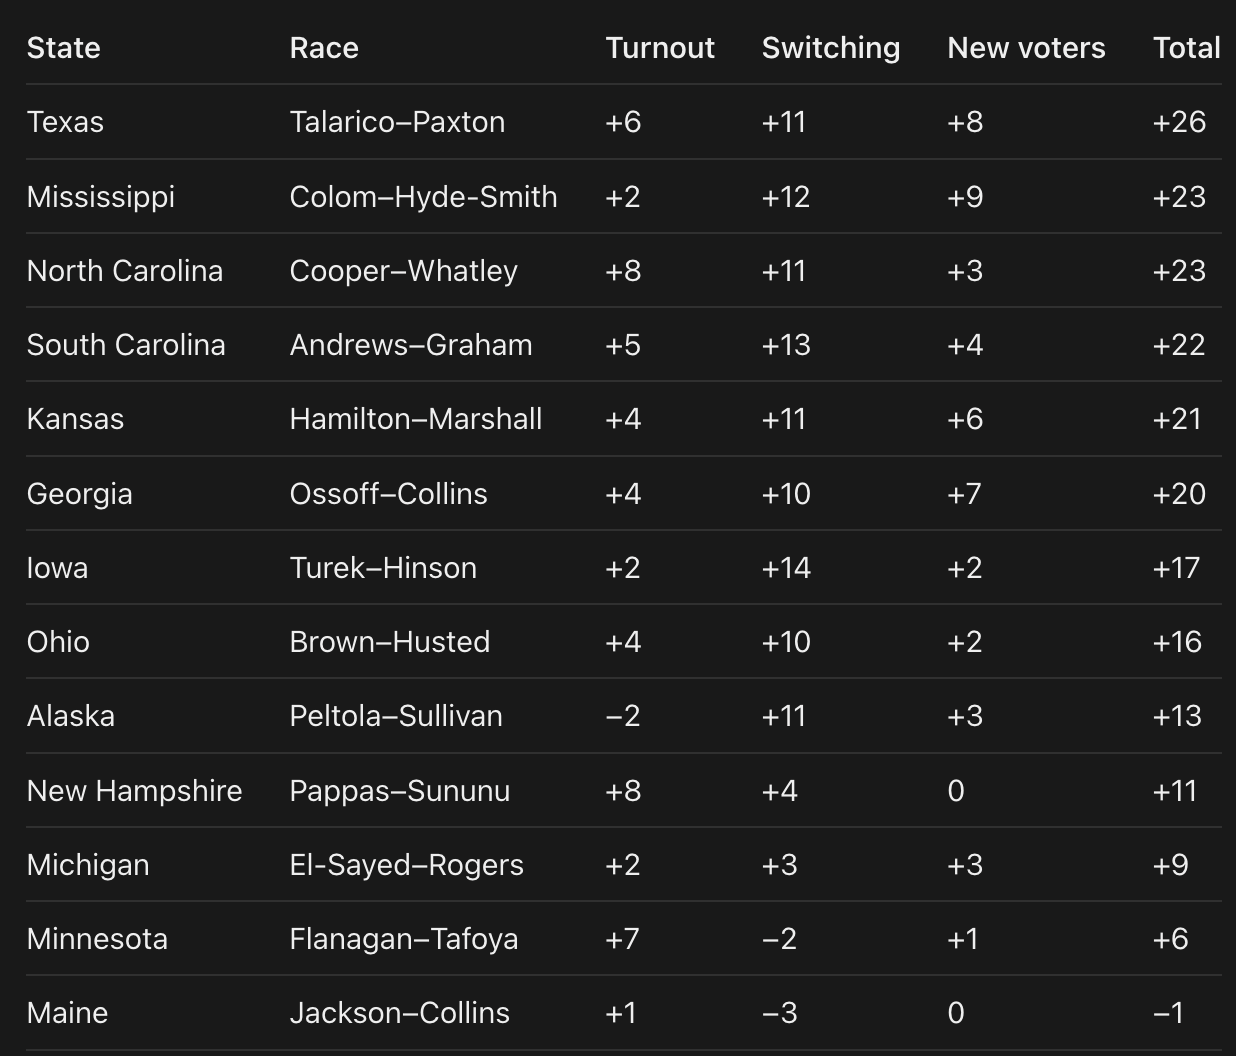
This data is noisier in key state races, with the difference that more of the turnout difference was loaded on voters who skipped the 2024 election, specifically in favor of Democrats. Because these were higher-salience races, you didn’t see above-average partisan turnout gaps among 2024 voters, but Democrats were possibly able to add around 8 points of margin in Texas, 9 points in Mississippi, 7 points in Georgia, and 6 points in Kansas based on voters who skipped 2024. In many voters, non-2024voters entirely covered or nearly covered the spread, having outsized impact in previously uncompetitive states where they made up 15 to 20 percent of the electorate and voted 20 to 30 points (or more) to the left of the 2024 margin.
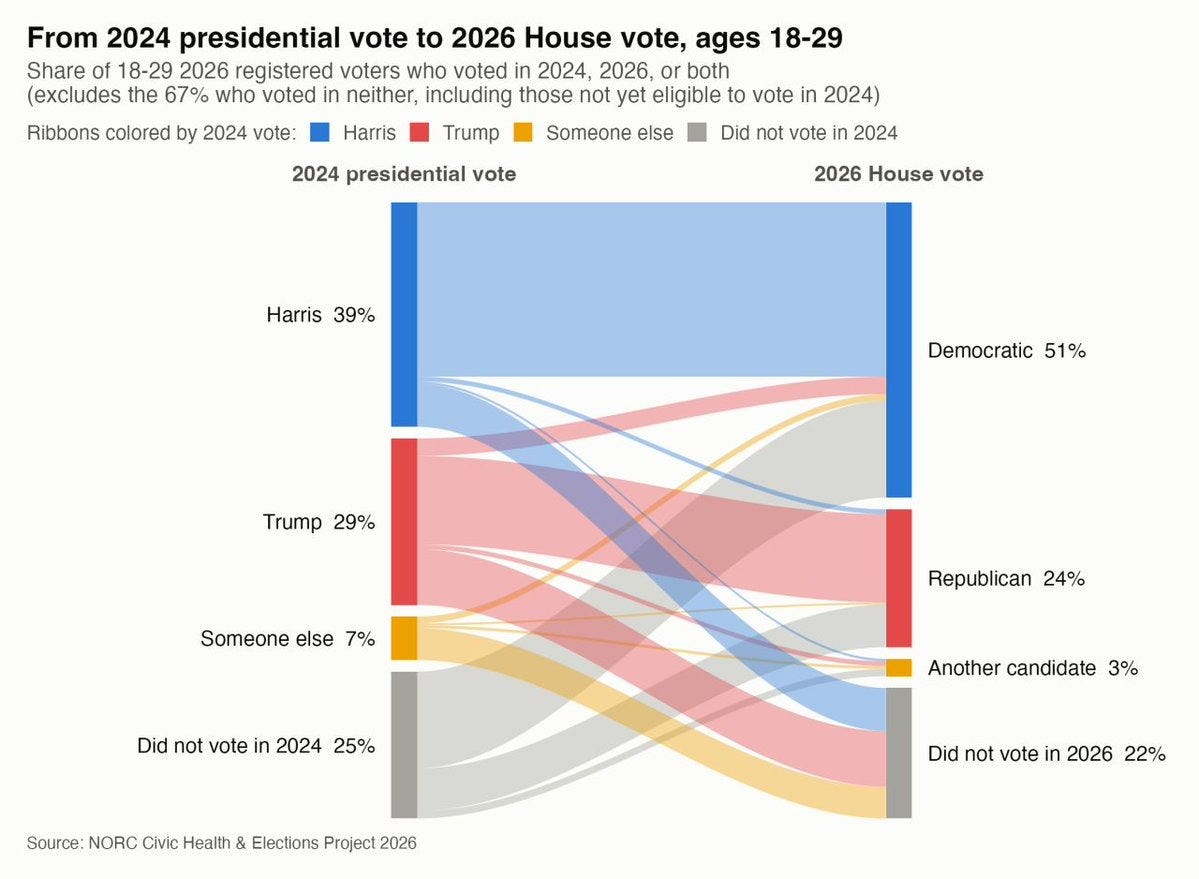
The flow chart Michael McFaul shared offers another view of younger voters, tracing movement between the 2024 presidential election and the 2026 House vote. Its population is narrower than all young adults: registered voters ages 18-29 who voted in at least one of those elections. Both switching and entering or leaving the electorate matter a lot.
🫏 Every Dem won, so there wasn’t as big an electability boost from moderation
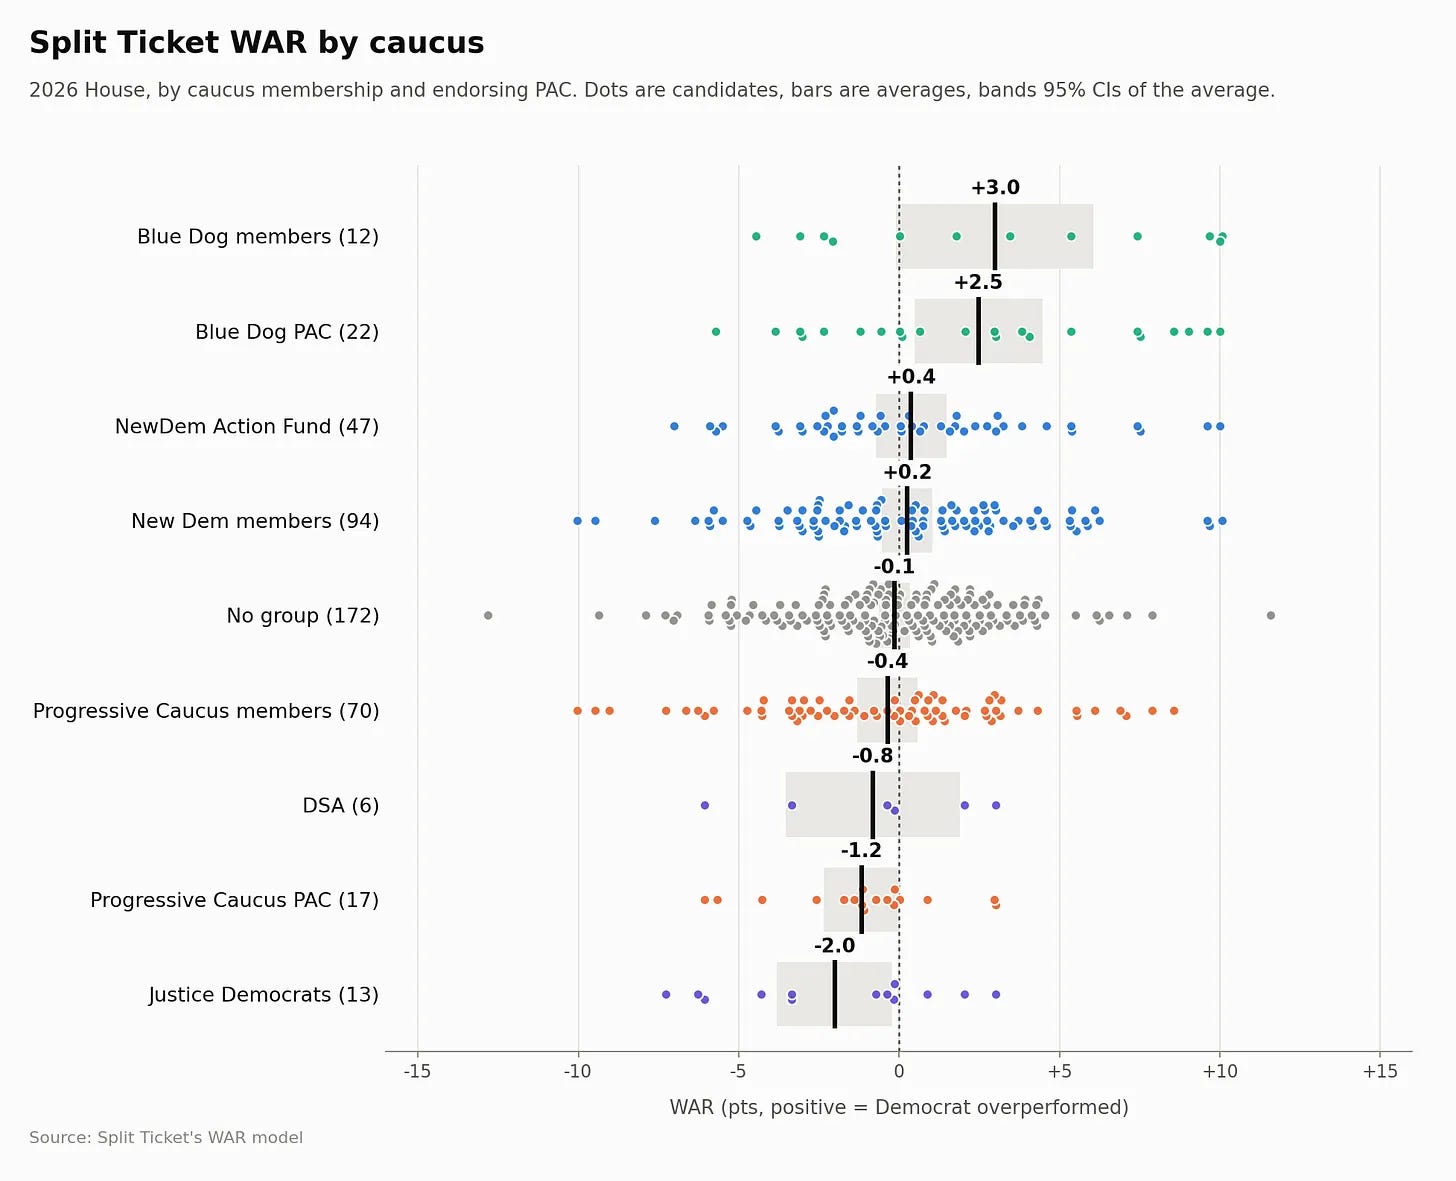
Split Ticket’s Wins Above Replacement (WAR) metric shows that while moderate candidates from both parties certainly had an advantage this election cycle, it was by a smaller margin than in years prior.
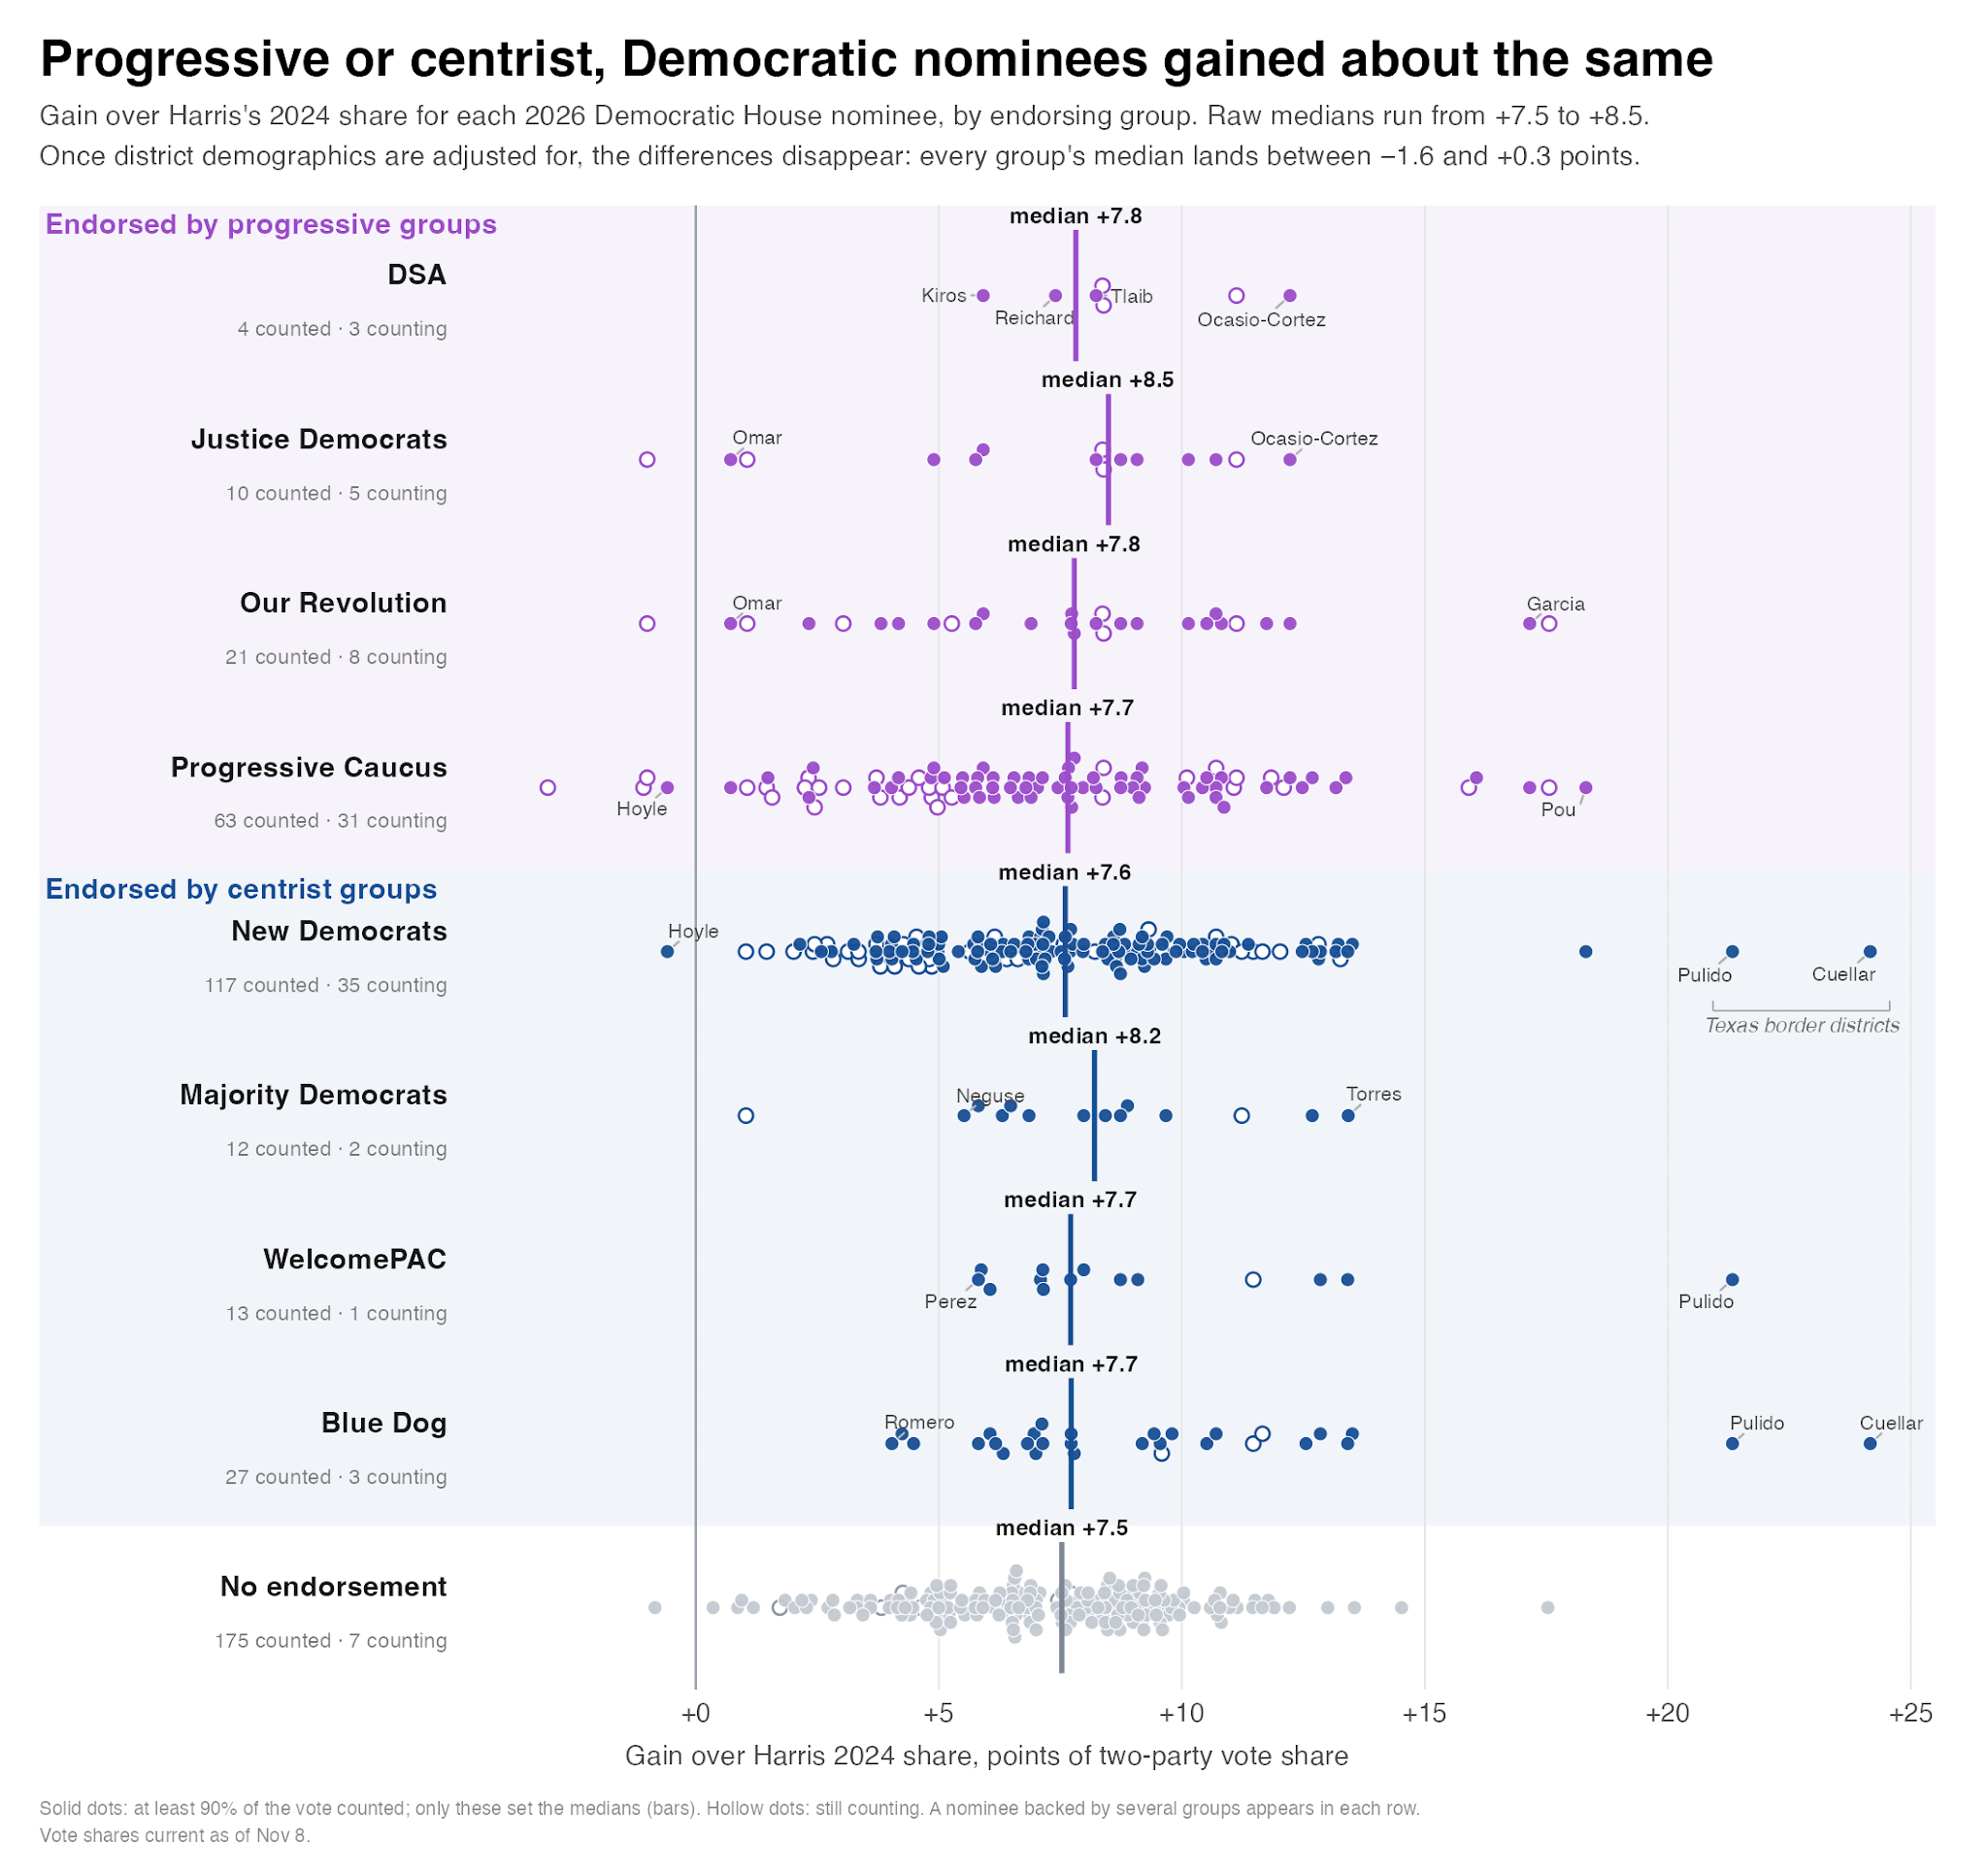
Adam Bonica’s analysis puts more weight on the national wave: across ten states, statewide candidates finished an average of just 1.3 points away from their party’s combined House vote. In Florida, former Republican David Jolly and DSA-aligned Angie Nixon finished only 0.8 points apart. His comparison of ideological groups makes a similar case.
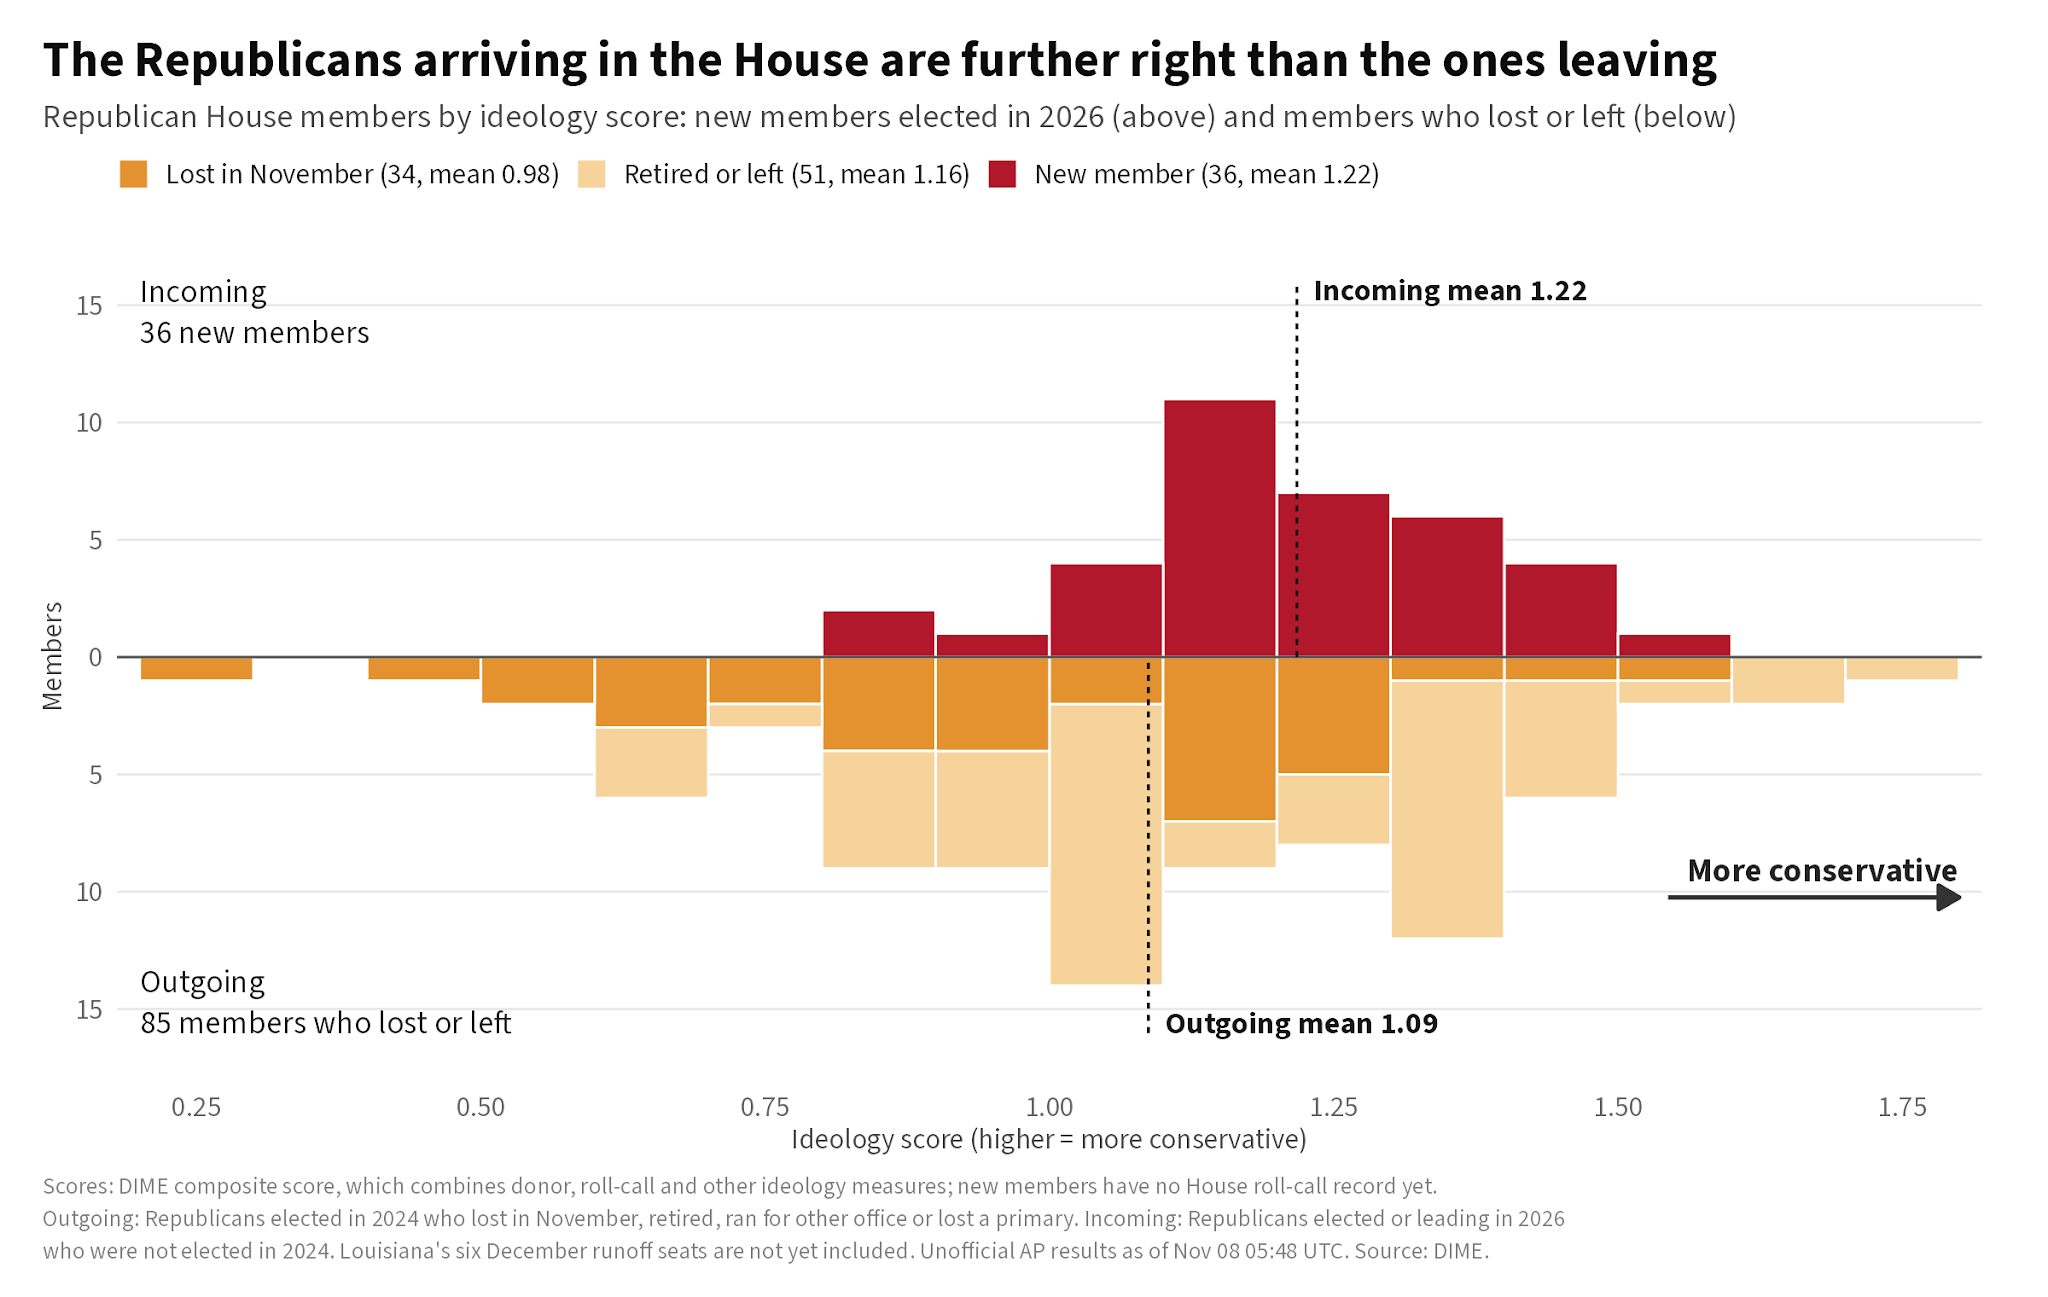
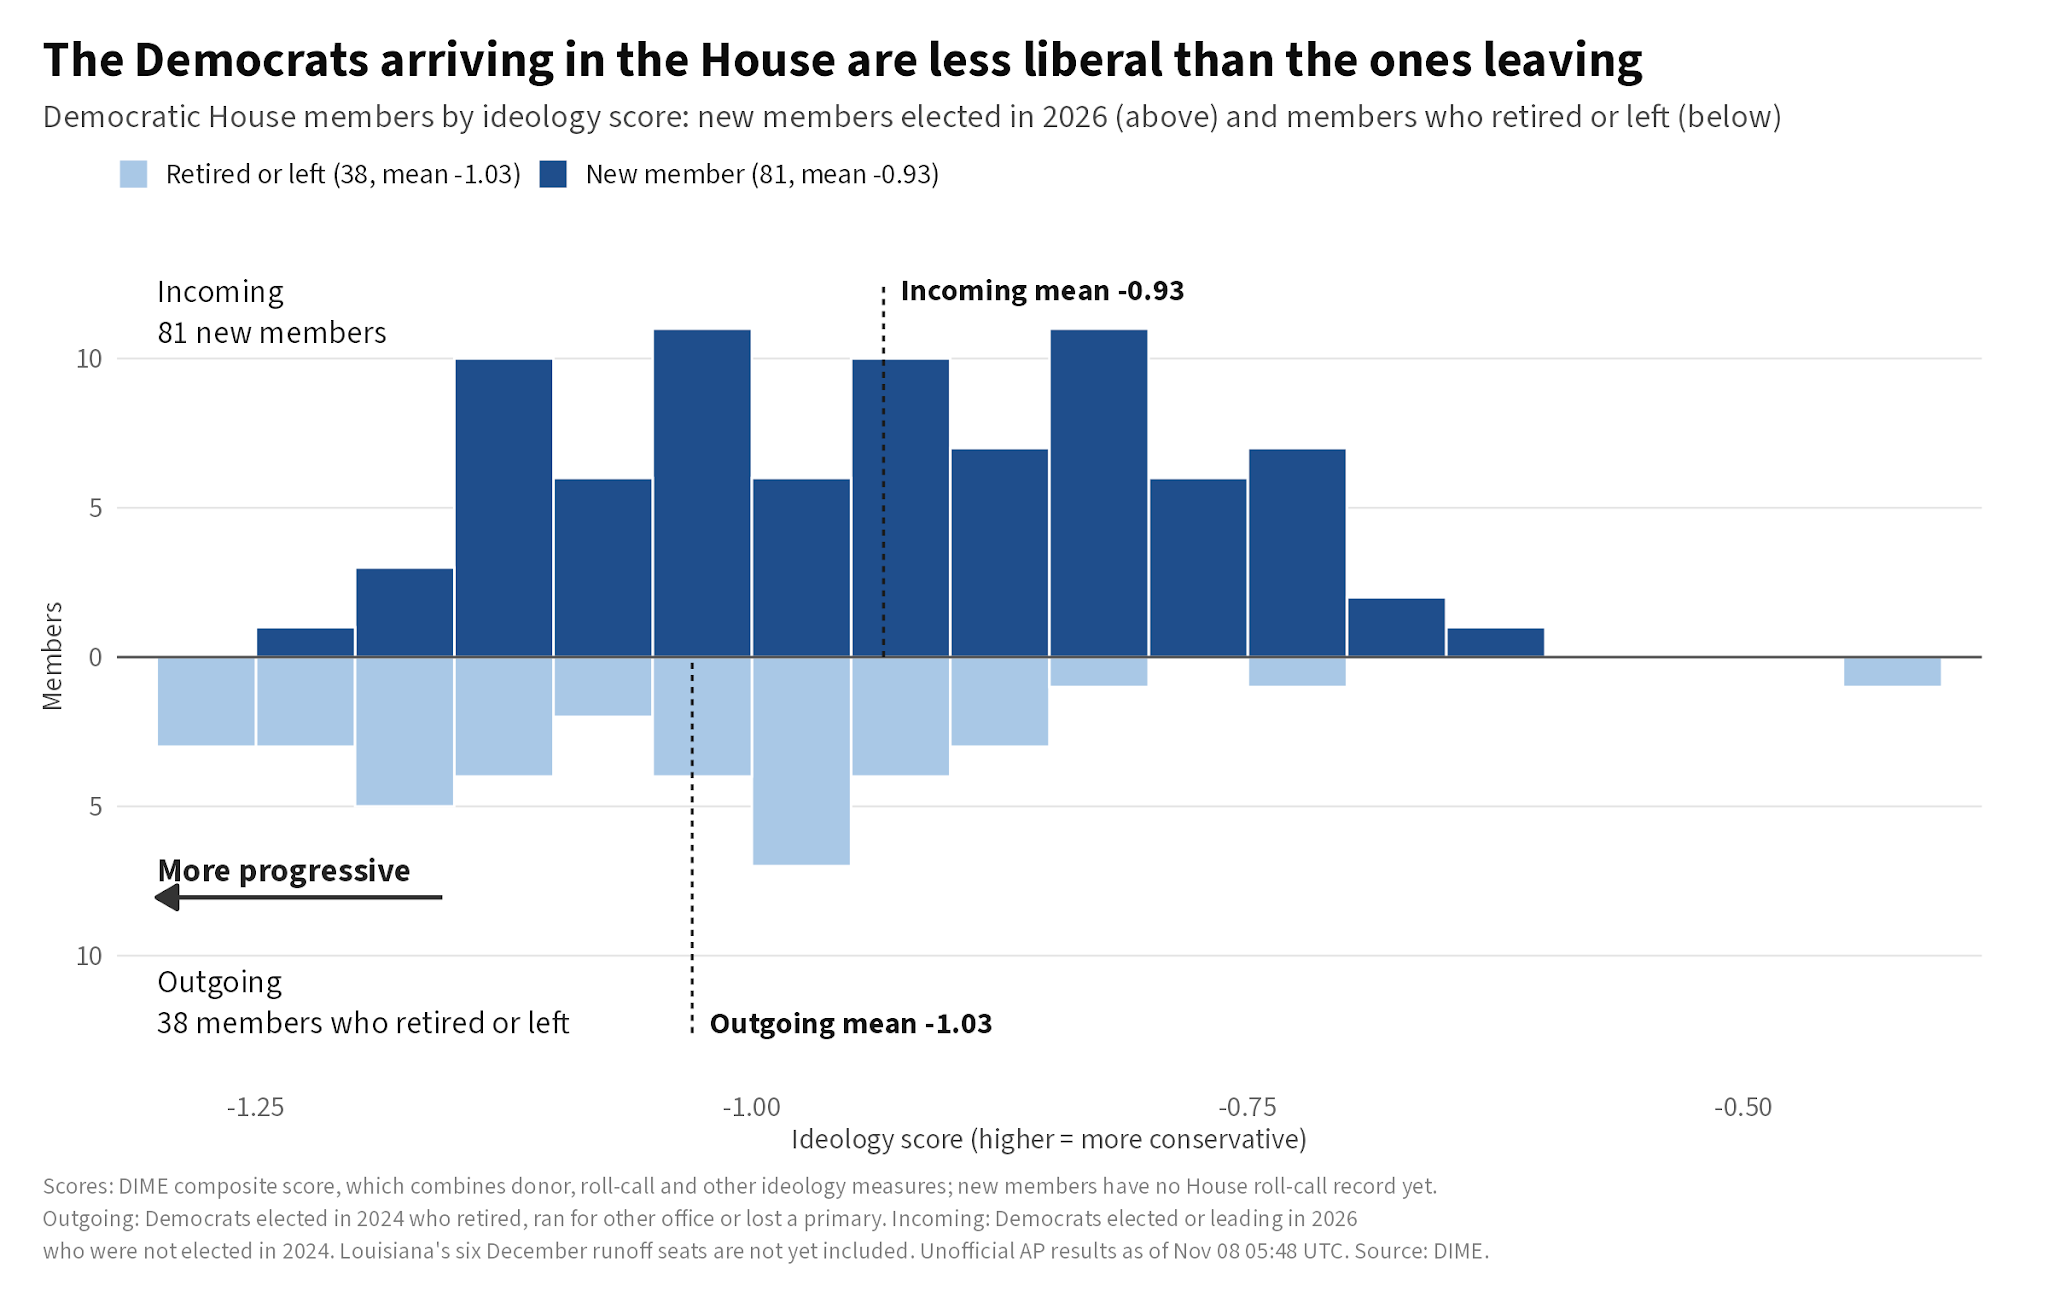
The bigger effect on the ideological makeup of Congress comes within the parties. Republicans lost a lot of their moderates while Democrats gained a bunch of moderates because swing district representatives tend to be more moderate to match their districts and Democrats basically won all of these seats.
📊 The polls missed the other way this time
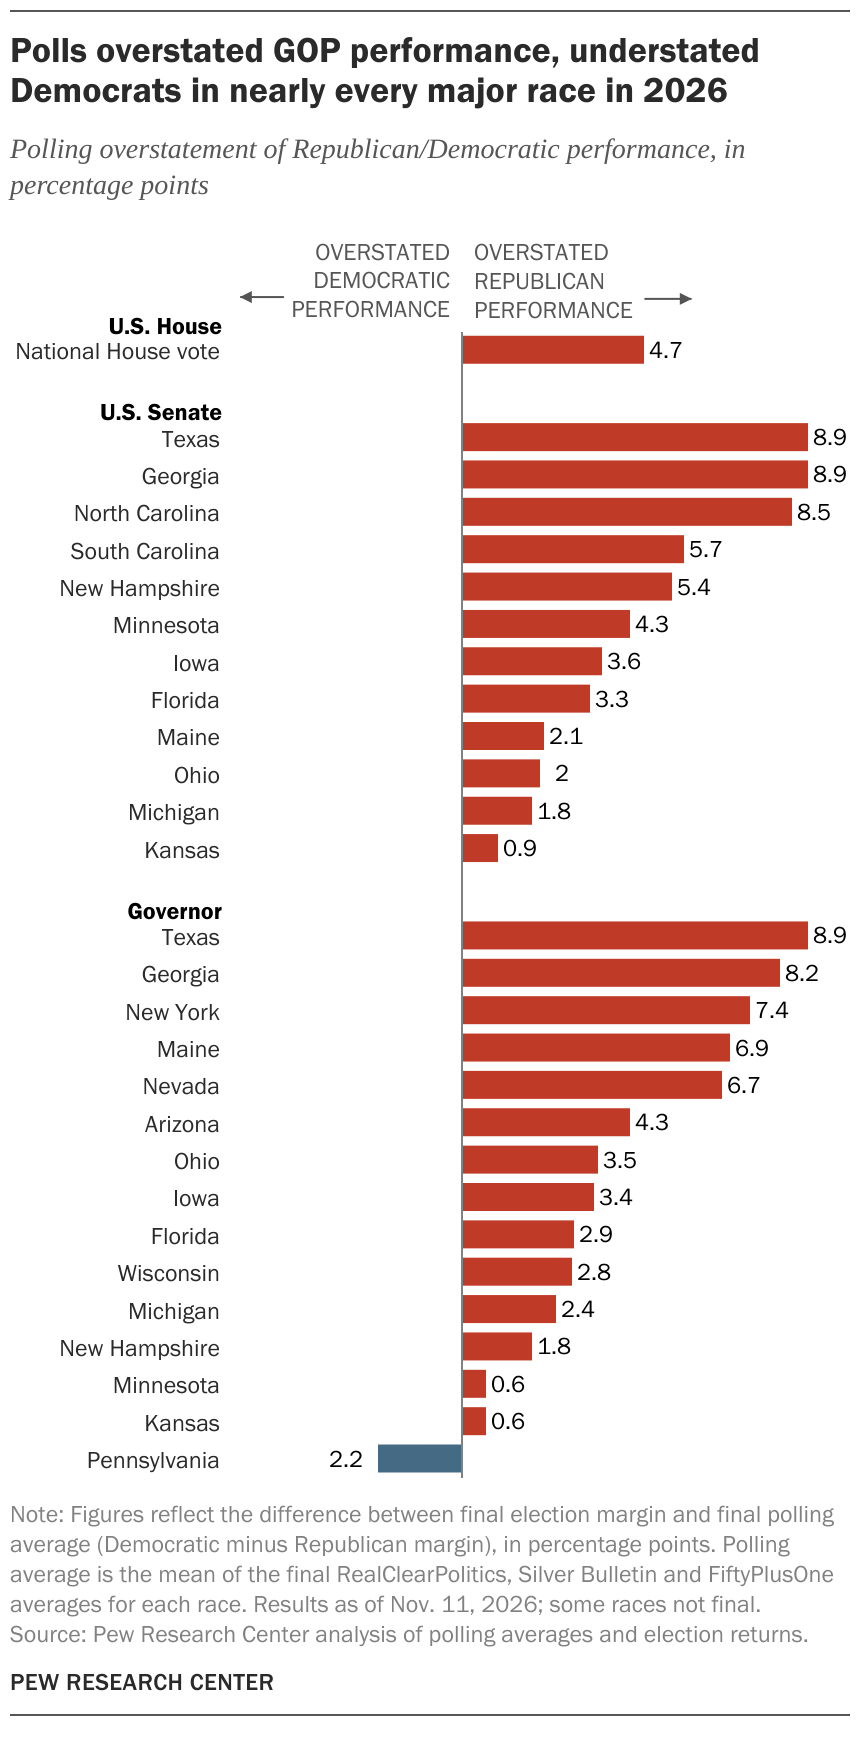
Pew’s first read finds that final polling averages understated Democratic margins by at least two points in 21 of 27 major statewide races. The average miss was about four points, while the national House polling error was 4.7 points.
Pollsters interviewed by the Washington Post point to turnout modeling and differing approaches to weighting by recalled presidential vote.
This is the first time polling error has missed significantly in favor of Democrats since 2012, after three consecutive presidential-level misses in a Republican direction in 2016, 2020, and 2024, and an accurate showing in 2018 and 2022.
🗺️ The geography beneath the wave
The New York Times “arrow” map of electoral shifts had a problem, which is that the shift was so big in so many places it became a huge blue blob that obscured regional differences. This county-level map shows where Democrats’ gains were stronger or weaker relative to a 14-point national swing benchmark.


💵 Cost of living-gate
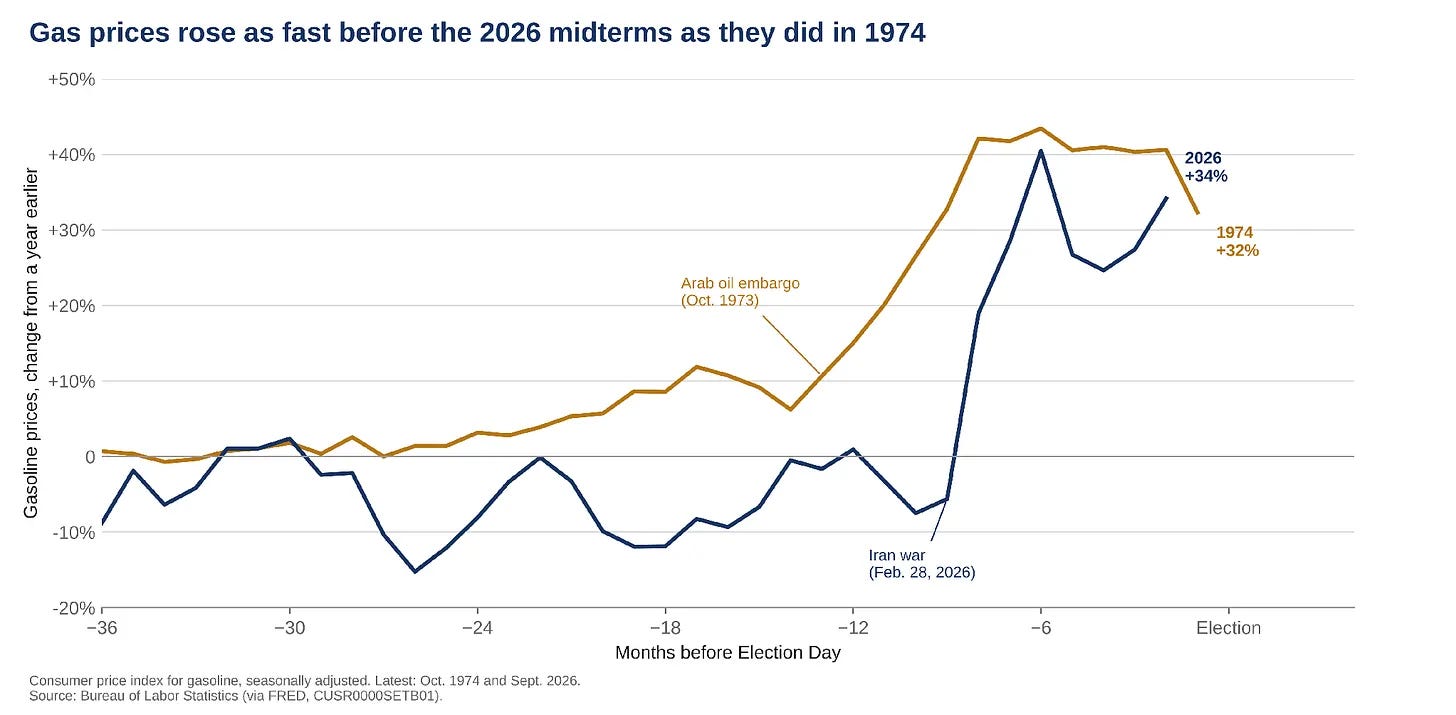
Cost of living is the name on everybody’s lips this election cycle. The last time we saw a shift of this magnitude and direction attributed to prices and corruption? Watergate, 1974. The increase in gas prices we saw from the Iran War was roughly the same in magnitude as those due to the Arab oil embargo of 1973.
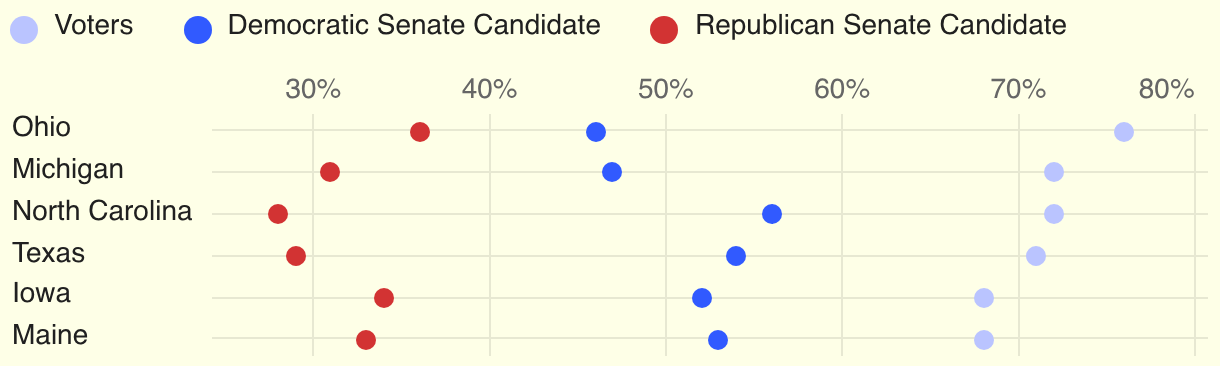
Searchlight’s entrance poll fills out the affordability story. Voters put the cost of living ahead of the attention they thought either party’s candidates gave it, but Democrats were perceived as much more focused on the issue than Republicans.
🗳️ A blue wave in a center-right country?
I remember when Barack Obama won and Republicans made the argument he’d be governing a center-right country. Republicans at the time were coping a little hard, though the subsequent Republican gains in 2010 vindicated them at least a little.
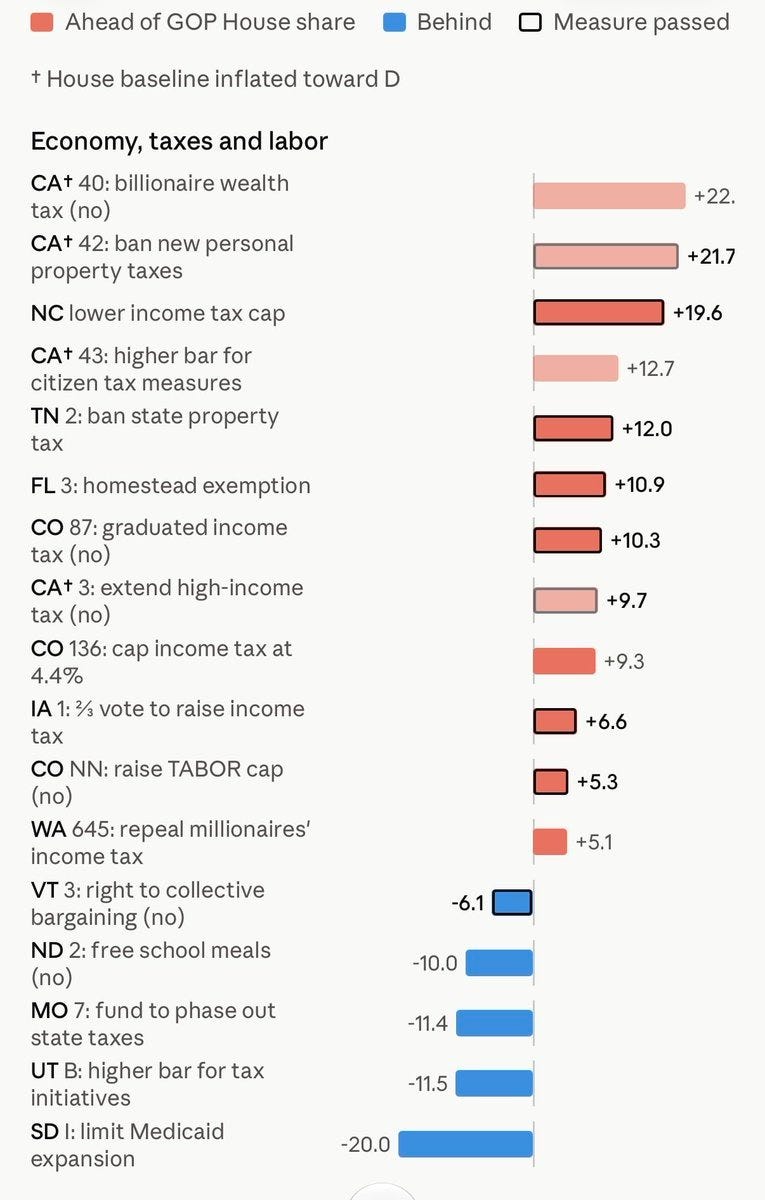
This year, the center-right side of ballot initiatives generally prevailed even in a very blue electorate. Otis Reid’s comparison using data from Tom Wood shows conservative positions frequently running ahead of the Republican House vote, including successful income-tax restrictions in North Carolina and Tennessee and a homestead exemption in Florida. His charts also show exceptions, including abortion, Medicaid expansion and limits on money in politics.
🤖 Are Chatbots politically biased?
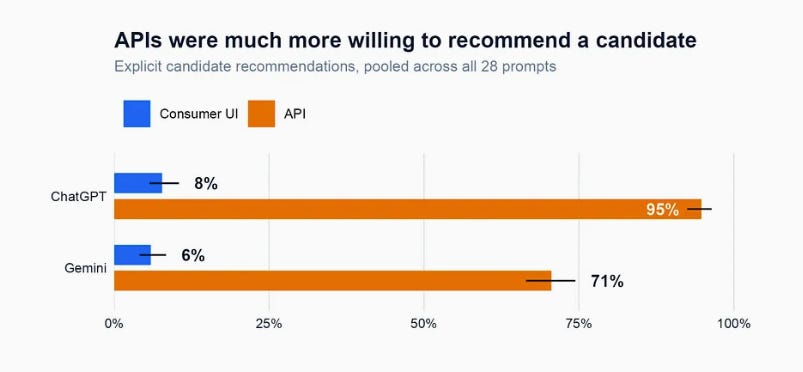
While AI labs tout the political neutrality of their chatbots, Caucus AI found that when accessed via their API, Chatbots are far more likely to recommend a specific candidate.
Editorial Note: Coming off a busy election season, the Friday roundup will come out less frequently from now through the new year. I have a series of state-specific autopsies in the queue and may have a few things to say beyond that.
Thank you for your support of The Intersection in 2026 — and I’m looking forward to a strong if still way-too-early start to the next presidential cycle at the top of 2027.