

21 Keys to the Keystone State
Part 2 of my analysis of Pennsylvania and 2024 dives deep into the state's political regions

Pennsylvania is a working class stronghold that helped to deliver Donald Trump the presidency in 2016, but other Republicans running statewide have struggled in his shadow. The Keystone State was part of the dramatic collapse of the Blue Wall in 2016, and swung back to the Democrats in 2020. Still, the 2020 margin was closer than expected — 1.2 points — and Pennsylvania increased its lean to the right of the country as a whole to 3.3 points. It is an absolute must-win for Trump in his return bid for the White House.
In my first installment on Pennsylvania’s political geography, I went through the macro regional and demographic trends that have shifted the state right. In this piece, I’ll go into more detail on the regions themselves.
I’m approaching my tour of the nation’s swing states differently than most analyses of this kind. The regions I describe are not counties or metro areas, but collections of precincts I’ve drawn using Redistricter that share common demographics and political behavior. So, while others might treat Philadelphia as a unit, I break it down into four distinct precinct clusters: Black voters, liberals, the white working class, and Latinos — and where it makes sense, some of these custom regions spread out into the suburbs. Add up the 21 regions of Pennsylvania, and you have a better sense of how the state as a whole will move.
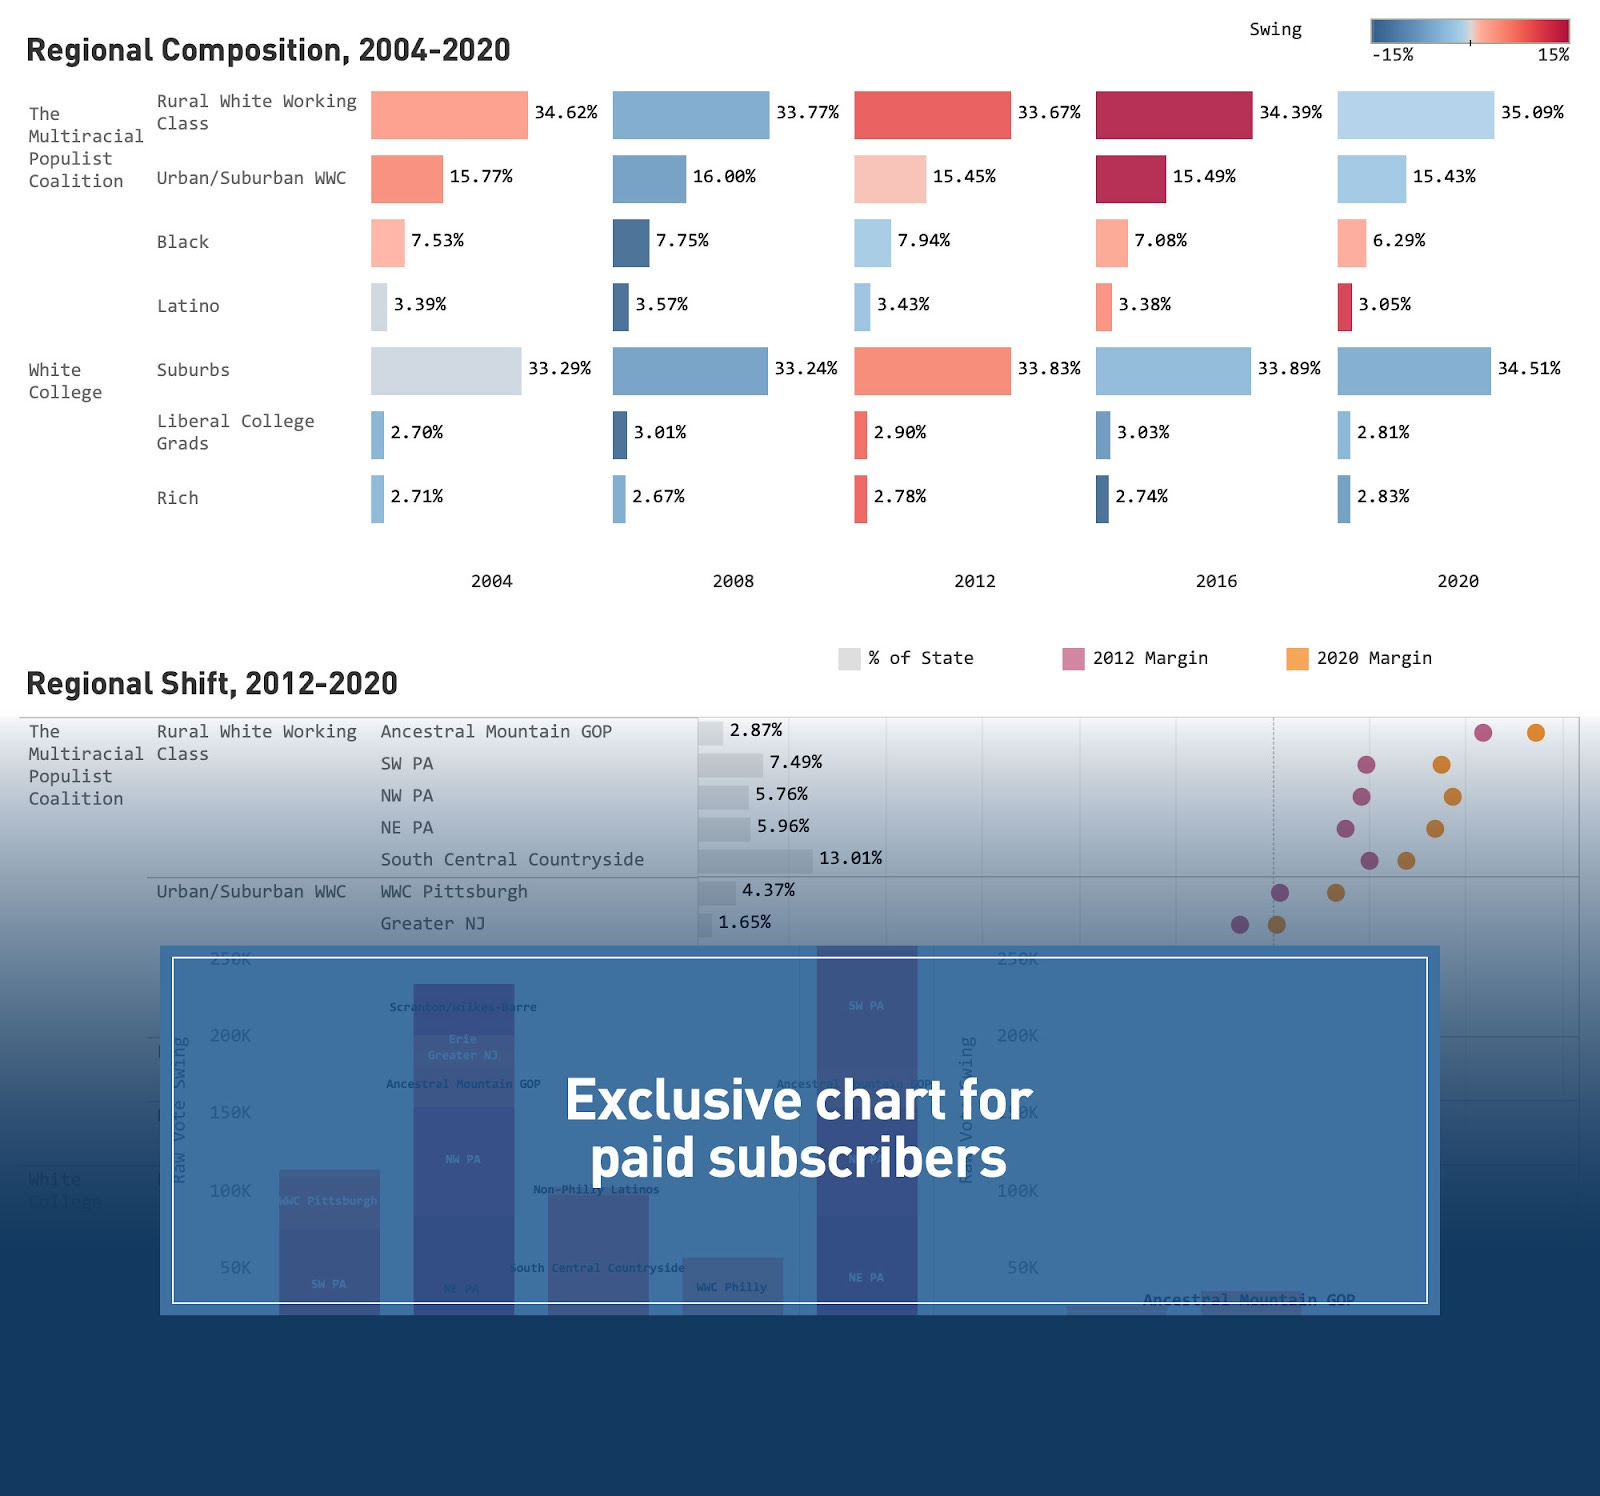
Before I dive into a political tour of the state’s regions, first a word about the demographic commonalities across regions. Areas dominated by the white working class made up 50.5% of the vote in 2020, areas led by racial minorities 9.3%, and areas where whites with college degrees hold more sway 40.1% of the vote. The largest bloc, rural white working class precincts, slightly outvote the main suburban grouping by 35.1% to 34.5% — though the latter is aided by a further 2.8% living in extremely wealthy suburbs. Nevertheless, the rural white working class has more than held its own, casting a record number of votes as a share of the Pennsylvania electorate in 2020. Of the working class vote, it is the minority areas that have fallen off, and specifically Black majority areas—casting 7.9% of the vote in 2012 and 6.4% in 2020.
Overall, the demographic balance in Pennsylvania favors the working class. Every single region with a working class majority, white or nonwhite, representing 6 in 10 voters in 2020, has swung right since 2012. But demography is no more destiny for the right than for the left: even if his support has eroded since, Biden was able to make some headway in white working class areas in 2020.
Now, on to the political geography of Pennsylvania, which I’ve broken down into four main regions. These are Philadelphia and its suburbs (32% of the vote in 2020), Central Pennsylvania and the Lehigh Valley (25% of the vote), rural Pennsylvania encompassing most of the counties commonly referred to as the “T” (21% of the vote), and Pittsburgh/Southwestern Pennsylvania (22% of the vote).

Density Map of the 2020 Election in Pennsylvania

The Philadelphia Metro — 32% of the vote

The Philadelphia metro has been and remains the engine of Democratic voting statewide. It’s not just the state’s rural areas that are solidly red if you factor out Philadelphia: The rest of the state is. If you tally up the margins from all the Democratic-leaning regions, around 80% of the Democrats’ net advantage comes from the Philadelphia metro.
Philadelphia’s significance for Democrats has grown over the last 20 years, but not as much as you might think. Even in an age of extreme urban-rural polarization, Republicans have found new votes in the blue collar parts of the Philly metro to partly offset the Democratic surge in the suburbs. And the larger story statewide is that Trump built a rural and Rust Belt bulwark that was big enough to outvote the Philly metro in 2016, and possibly again in 2024.
Suburban Philly — 16.6% of the vote, D+19, D+14 since 2012
This region includes all the parts of Bucks, Montgomery, Delaware, and Chester Counties that swung left between 2012 and 2020. It’s also the largest of our regions, representing 16.6% of the statewide vote in 2020. 53% have college diplomas and one in five households have annual incomes over $200,000 per year.
Biden won this area by 19 points in 2020, and it’s swung left by 14 points since 2012, the last election held in the Before Times. The area now represents almost as big a share of the Democratic margins from the Philadelphia region as majority Black areas do, an historic shift given that this area was essentially tied as recently as 2000.
In 2016, only areas with college-graduate majorities like the Philadelphia suburbs swung towards Hillary Clinton. In 2020, the Democratic coalition was more broadly based, and there was a regional element to the swing, with the eastern half of the state swinging by 3-4 points more than the west. This led to a 6 point swing left in the Philly suburbs, further increasing the Democratic majority by about 90,000 votes.
Rich Philly — 1.1% of the vote, D+31, D+32 since 2012
The wealthier cousin of Suburban Philly, this cluster of precincts in the Main Line suburbs and some areas in Bucks County swung 32 points left since 2012, nearly mirroring its Biden margin of 31 points. This 2-to-1 Democratic advantage among the wealthiest denizens of the Philly metro (and Pennsylvania as a whole) came about entirely in the age of Trump.
Almost 4 in 5 adults (78%) over the age of 25 here have college degrees and almost half (48%) have incomes over $200,000.
Black Philly — 5.5% of the vote, D+87, R+5 since 2012
This traditional mainstay of the Democratic coalition in Pennsylvania has seen its Democratic vote margins narrow and relative turnout decline in the Trump era, but it still remains a formidable force, delivering an 87 percent margin for Biden in 2020.
The population of these mostly inner city precincts is declining. This area cast 3.5% fewer raw votes than in 2012 despite increased turnout statewide. By contrast, votes cast in the suburbs grew by 22%.
Black residents of this area have been gradually migrating outward to the suburbs. Many of the Black majority areas in southwest and northeast Philadelphia are new, having seen significant white flight over the last 20-30 years. Adjacent suburban areas like Drexel Hill and Delaware County are seeing rising Black populations. Mapping the growth and decline of the Black population from 2000 to 2020 in the subscriber-exclusive graphic shows the growth patterns clearly, and also white gentrification around Center City nibbling at the edges of this working class community.
Black Population Growth and Decline in Philadelphia, 2000-2020

WWC Philly — 6.0% of the vote, D+14, R+12 since 2012
White Working Class (WWC) Philadelphia includes the parts of the city and the suburbs where whites without college degrees are the dominant voting bloc. This area swung right by 12 points between 2012 and 2016, with a further swing right of 1 point in 2020. This shift nearly matches the magnitude of the swing left in the main Philly suburbs, but on less than half the voting strength.
This area includes ethnic white Philadelphia neighborhoods historically hostile to Black Democratic mayors but which voted reliably Democratic at the presidential level. Today, the area as a whole is approaching swing territory, with a Democratic margin of 14 points in 2020, cut almost in half since 2012.
Even as this area grows more diverse, it continues to shift right. Hispanics have gained steadily as a share of the population throughout Northeast Philly and Lower Bucks County. The Lower Northeast is now a veritable melting pot, with significant Latino, Black, and Asian populations, a far cry from its racially intolerant image of yesteryear.
Latino Philly — 0.7% of the vote, D+66, R+19 since 2012
Latino-majority areas in Philadelphia are small in size but a useful distillation of Latino trends statewide. These precincts swung 19 points right since 2012, with 16 points of that swing coming from 2016 to 2020.
This small area remains quite Democratic, by 66 points in 2020. Latinos represent a bare majority, 57 percent, of the voting-age population in these precincts. Black voters are a further 22 percent. The margins here reflect the solid Democratic allegiances of the Puerto Rican and Dominican communities which make up the majority of Hispanics in Pennsylvania—an allegiance which nonetheless began to soften in 2020.
Liberal Philly — 2.2% of the vote, D+73, D+10 since 2012
The liberal heart of Philadelphia, including Center City, West Philly (near the Penn and Drexel campuses) and northwest Philly, this area delivered a 73 point majority for Joe Biden in 2020.
More than 7 in 10 adults here have college degrees, but its 10 point swing left since 2012 was much lower than in comparably educated parts of the suburbs. Democrats were already performing so well here that there was little room for them to grow, showing the natural limits of polarization. Like voters in the suburbs, the do-gooders here can split their ticket if a Republican shows sufficient distance from Trump, with a 9 point overperformance for Pat Toomey in 2016, similar to the 11 points Toomey overperformed by in the suburbs.
Central Pennsylvania and the Lehigh Valley — 25% of the vote
When my Echelon Insights colleagues calculated the most “normal” counties in America based on a host of political and demographic variables, a cluster of counties in central Pennsylvania and the Lehigh Valley consistently came out on top. In 2022, Lehigh County, home of Allentown, was ranked the most demographically normal county in America. In 2018, Dauphin County, home of Harrisburg, held the crown. The span of counties in between—a mix of small cities with burgeoning subdivisions sitting next to picturesque farmland—all rank extremely high in this measure of demographic normalcy.
Some might object to how expansive this region seems—but the same basic trends are unfolding on its eastern and western extremities. And taken as a whole, it is becoming the state’s bellwether, holding the balance between the very blue Philadelphia region and the rural areas. Making up just over half of this region’s population is a heavily-populated small-town countryside that remains the largest driver of GOP votes statewide, surrounding the state’s highest-growth suburbs where GOP losses have been accelerating, and Latino communities that are transforming the region’s small cities.

South Central Countryside — 13.0% of the vote, R+28, R+8 since 2012
The second largest region of the state and the most vote-rich GOP heartland, representing a mix of revolutionary-era small towns, farms, and urban white working class areas in central Pennsylvania and the Lehigh Valley, it delivered for Trump by a margin of 28 points in 2020, 8 points more than Mitt Romney’s margin in 2012.
Contrary to the image of “declining” rural GOP bastions, its vote totals grew from 27% from 2012 to 2020, the second highest vote growth in the state. Containing bucolic landscapes including Pennsylvania Dutch Country, it is still growing in population while trending right.
The South Central Countryside can be considered a more mild version of the more sparsely populated rural areas elsewhere, voting Republican by slightly lower margins with less of a shift right under Trump. Just short of 25 percent here have college degrees.
South Central Growth — 9.8% of the vote, R+3, D+11 since 2012
Currently the fastest growing part of the state, the South Central Growth region contains all the suburban parts of central Pennsylvania and the Lehigh Valley. It is trending left at a relatively fast clip, with Republican margins cut from 14 points in 2012 to just 3 points in 2020.
This leftward shift is being driven by growth by new development outside Harrisburg, York, Lancaster, Allentown, and Bethlehem. And Democrats at the local level are flipping formerly staunch GOP bastions like York and Cumberland Counties.
The population has grown by 27 percent since 2000, compared to 15 points in the Philly suburbs, which is more often cited as a GOP problem. It is a notch or two more downscale than the Philly suburbs, though, with 4 in 10 having college degrees and just 1 in 10 having incomes over $100,000. The big question in 2024 will be whether these fast growing suburbs start voting to the left of the state as a whole.
Non-Philly Latinos — 2.4% of the vote, D+34, R+14 since 2012
Puerto Ricans and Dominicans have gradually taken over the downtowns of small cities like Reading, Lancaster, and Allentown, making this region collectively the largest Latino vote center in Pennsylvania. In many of these downtowns, the Latino share of the population has nearly tripled since 2000. Nonetheless, Latinos are only a narrow plurality in the voting age population in these areas — 45 to 44 percent over whites, and one assumes still lower in the share of registered voters who cast ballots.
The area still votes Democratic by 2-to-1 margins, but those margins have shrunk by 14 points since 2012, with 7 points of the shift happening since 2016.
Lying geographically outside the Central/Lehigh region (but still included in this political region) is Hazleton, a coal country town that has seen extreme levels of demographic change since 2000, with Hispanics going from 5 percent to 75 percent of the population. Despite this, the city has become more Republican in the last 20 years, with Trump carrying it by 10 points in 2020 after being narrowly divided split in every other election this century. This shift right is a far cry from what was envisioned by anti-immigration forces in the early 2000s, when Hazleton became famous for one of the most stringent anti-illegal immigration ordinances in the country under then Mayor and future Congressman Lou Barletta.
Rural Pennsylvania and the “T” — 21% of the statewide vote
When James Carville uttered his famous quote about Pennsylvania as “Philadelphia and Pittsburgh with Alabama in between,” the central Pennsylvania “T” was what he was referring to as Alabama. Very simply, carve out the southeast corner with Philadelphia and the southwest corner with Pittsburgh, and you’re left with something that looks like a “T.”
The story is obviously a lot more complicated than that: the cities and small towns of central Pennsylvania and up to the Lehigh Valley are an increasingly competitive battleground. But the remainder of the old “T” — with a few exceptions — has been red and getting redder.
Greater New Jersey, 1.7% of the vote, R+1, R+8 since 2012
Jutting out into New Jersey and New York, Pike and Monroe Counties are their own political ecosystem, part New York bedroom community, tourism destination, and diverse service workers. Manhattan commuters seeking a more affordable lifestyle gladly pay more than $500 a month for a Martz bus pass to take them 85 miles to their downtown offices.
The area is the closest in the state to a true bellwether, voting for the winning candidate in every election since 2000 except in 2020 when it backed Trump by less than a point. It swung strongly to the right in 2016 but reverted to the left in 2020 despite having a large minority and working class population, not a recipe for a Biden overperformance. That’s a function of its greater exposure to trends to nearby areas in New Jersey and New York that also swung left in 2020.
This area has grown the most of any other part of the state, with an 89% increase in population since 1990. Just 35% of the residents here were born in Pennsylvania, by far the lowest number of any region. A high percentage of the population also works in other states, visualized by the purple areas on the map.

In a state where no racial minority cracks 10%, both Blacks and Hispanics have built a considerable foothold in Greater New Jersey, with 12% and 14% of the voting-age population respectively. The community of East Stroudsburg serves as a prime example of these populations seeking opportunity outside the major urban centers. If you want a region that’s a true bellwether, this is it. But it’s also extremely atypical of the state as a whole, more New Jersey and New York-oriented than truly Pennsylvania.
Scranton/Wilkes-Barre, 2.4% of the vote, D+7, R+19 since 2012
Trump’s more than 20-point gains in the Wyoming Valley were among the biggest shocks of the 2016 election. In 2020, “Scranton Joe” was able to recover some ground here, with a 5-point swing his way, but the 2020 New York Times swing map makes clear that this was more a function of a broader regional swing in the Northeast than of his local upbringing.
As described in my earlier companion piece, the 2012-16 swing right was stronger here than anywhere else due to the fact that more white working class voters in Scranton voted for Obama than did elsewhere. While the Pittsburgh metro had already started its turn against the Democratic Party in the Obama era, Scranton still had many Democratic ancestral holdouts in 2016. That made it a powder keg for Trumpian realignment by the time 2016 rolled around.
The region represents all of Scranton and Wilkes-Barre, and still leans Democratic on the back of Scranton’s votes. Even a region that has been moving quickly right has a more upscale, blue-trending suburban part in Clarks Summit. The area as a whole is diversifying, with a growing Black population in Scranton proper.
The region is 83% white and only 26% college-educated, just a touch above the reddest, more rural parts of the state, underscoring the opportunity for Trump in 2016.
Northeast Pennsylvania, 6.0% of the vote, R+34, R+19 since 2012
The first of our hardcore rural areas, Northeast Pennsylvania — essentially the state’s entire northwest quadrant minus Scranton/Wilkes-Barre and Greater New Jersey — is 92% white and just 22% have college degrees. This area is a hub of anthracite coal mining and also at the center of the fracking revolution. In the areas where coal was strongest, the pro-Trump swings were more extreme. Take for instance this cluster of precincts around Shenandoah and Pottsville with 40 to 60 point swings in 2016.

Total votes cast increased by a strong 27% from 2012 to 2020, the result not of a population influx but of rural, low-propensity whites joining the electorate to vote for Donald Trump. That outdid many of the more suburban parts of the state growing in population.
The area swung almost 4 points left in 2020, part of a broader trend in eastern Pennsylvania, but Trump netted more raw votes from the region thanks to higher turnout.
Northwest Pennsylvania, 5.8% of the vote, R+37, R+19 since 2012
The most heavily forested and least densely populated part of the state, the state’s rural northwestern quadrant (minus downtown Erie) tells a similar story as our other rural regions. All have swung just shy of 20 points from 2012 to 2020. Unlike Northeast Pennsylvania, Trump held all of his 2016 support here, with a swing right of 0.1 points.
The demographics here are consistent with other rural parts of the state: 93% white, 21% college educated, just 1 in 40 households with incomes over $200,000, and 82% born in Pennsylvania.
State College, 0.6% of the state, D+33, D+19 since 2012
The home of Penn State could not be any more different than the region which surrounds it, an area where 67% are college graduates and which swung 19 points to the left since 2012 and fully 32 points since 2000.
State College also saw a strong swing left of 8 points in 2020 though its vote totals dropped since 2012, likely the result of students not on campus during the pandemic.
Erie, 1.1% of the vote, D+18, R+10 since 2012
Our Erie region is carved out of Northwest Pennsylvania, and represents just the urban part of Erie County. While the county itself is now competitive in presidential elections, a sign of the Republican Party’s strength among working class voters in this industrial stronghold, the urban parts voted for Biden by 18 points in 2020.
Erie has shifted 10 points right since 2012, including shifts right in minority-heavy downtown areas. The area is still 80% white, but the majority nonwhite parts downtown have led the shift.
Ancestral Mountain Republicans, 2.9% of the vote, R+54, R+11 since 2012
All of rural Pennsylvania is now safely Republican, but this Altoona-centered region in the Appalachian mountains is really Republican, voting for Trump by 54 points.
This region has stood out from the rest of the state in its Republican loyalty for decades. It voted for George W. Bush by 36 points in 2000 while the outlying rural areas of Pittsburgh next door split evenly. Now, the gap between the two has mostly closed.
As a result of this already strong performance, there was little room for the region to grow: it only moved 10 points right from 2012 to 2016, compared to shifts of 18-20 points in other rural areas—a similar phenomenon to that observed in areas like Center City Philadelphia that were already strongly Democratic.
Pittsburgh & Southwest Pennsylvania — 22% of the vote
Most of the regions in and around Pittsburgh have direct counterparts in the Philadelphia metro, but politically, the two metros have diverged. Even before 2016, the Pittsburgh metro was swinging right, and between 2016 and 2020, it managed to evade the shift left seen in the more populous east. Whether the neighborhood is working class or affluent, the Pittsburgh metro looks better for Republicans cycle after cycle.
In 2016, what had been a regional shift right was supplanted by a demographic divide on education lines that tugged the college-educated parts of the area slightly left and the white working class parts solidly to the right, netting out to Trump gains from the metro as a whole.

The Pittsburgh metro is also distinguished by a dwindling industrial base and a declining population, something true generally throughout the western half of Pennsylvania. This manifests in a relative lack of newcomers and a very high percentage of the population that is born in state. The rate of those born in state is 86% in the working class Pittsburgh suburbs, about the same as in the rural parts of the state, and almost 20 points higher than in the comparable parts of Philadelphia. In more college-educated suburban areas, the figure is 77%, about 10 points higher than the Philly suburbs. With its relatively stable population, the Pittsburgh metro and its environs have produced gains for Trump that have helped to cancel out losses from the Philadelphia metro.
Suburban Pittsburgh, 8.1% of the vote, D+12, D+9 since 2012
Biden won the parts of the Pittsburgh metro where college graduates hold more sway by 12 points. Instead of the 14 point swing seen in the Philly suburbs since 2012, the Pittsburgh suburbs swung 9 points. On a longer time horizon, the divergence between the two is stark: just a 5 point shift left since 2000 compared to 19 points in the Philly suburbs.
Suburban Pittsburgh is a notch down from the Philly suburbs both educationally and income-wise: 47% with BAs (vs. 53%) and one in ten households with incomes over $200,000 compared to two in ten. It is 80% white.
Rich Pittsburgh, 1.7% of the vote, D+10, D+27 since 2012
Like Philadelphia, the Pittsburgh suburbs have a wealthier auxiliary — one that includes outposts like Fox Chapel, Sewickley Heights, and Mt. Lebanon. Drawing a cohesive group of suburban communities that stand out from the rest on income and education yields a larger, less selective grouping than in Philadelphia, but with the same sharp shift left under Trump: 27 points since 2012, three times that of the surrounding middle class suburbs.
One key difference from the wealthy Philadelphia suburbs is that these parts of the Pittsburgh suburbs started out much further right, so they are now only Democratic by 10 points, compared to the 31 points margin outside Philly.
67% of the people in this area are college graduates, 27% of households have incomes over $200,000, and 87% are white.
WWC Pittsburgh, 4.4% of the vote, R+13, R+12 since 2012
With the exception of the outlying southwest Pennsylvania counties, no part of the state has swung harder to the right since 2000, with a margin shift of 30 points. Most of the shift happened before Trump, much of it under Obama.
Pittsburgh’s white working class areas have swung further right since 2012, now delivering Republican majorities.
If any suburban area behaves socially and culturally like a rural white working class stronghold, it’s these parts of Pittsburgh. It has almost as many whites, just as few degree-holders, just as many people born in state, and the same income distribution as most of rural Pennsylvania.
Black Pittsburgh, 0.7% of the vote, D+80, R+5 since 2012
The Pittsburgh area as a whole is much less diverse than Philadelphia, with Black majority areas present but one-eighth the size of those in Philadelphia. Like its larger counterpart to the east, Black Pittsburgh swung modestly right since 2012, but here again, the bigger story is the drop in turnout.
When it comes to Pittsburgh’s Black population, the more interesting story is one of suburbanization and integration. The population has been steadily moving out of the old Black population centers and to inner suburbs like Penn Hills, Forest Hills, and McKees Rocks. The map below shows Black population gains since 2000 in green, while the red areas with borders around them show declining Black majority precincts. These areas of Black population growth straddle the line between middle class and working class Pittsburgh suburbs. Surprisingly, changing demographics in the areas with a large Black population influx have barely shifted the political equilibrium, with a shift left of just 2 points in these precincts in the last 20 years. But perhaps that should be considered a Democratic victory in the context of a metro region that’s moved decidedly to the right in that timeframe.

Southwest Pennsylvania, 7.5% of the vote, R+35, R+15 since 2012
No part of the state has undergone a more rapid political transformation than the southwest corner of the state. Coal is a major reason why. Like their West Virginian neighbors to the south, places like Washington and Greene County has shifted from solidly and ancestrally Democratic to a fount of Republican votes in the age of Trump. The region as a whole has shifted right by 35 points since 2000, with 20 points of the shift predating Trump. In the heaviest coal producing parts, it’s not hard to find precincts that have swung 95 points in this period.

Paid subscribers will see exclusive charts below. If you appreciate this depth of analysis, I hope you’ll consider starting a paid subscription.
For Pennsylvania and the rest of the swing states, I will be writing a paid Path to Victory analysis that will outline what it will take for Republicans to win in November using these regional breakdowns.
