

Is Arizona the Democrats’ Last Sun Belt Hope?
From crucible of conservatism to ultimate swing state, how Arizona charted its own political path

Arizona once again finds itself center stage in presidential politics. Prior to his debate collapse, Arizona was the Sun Belt state where one could have made the most optimistic case for Joe Biden — and maybe still if there’s a replacement nominee.
The story in Arizona in 2016 and 2020 has been one of steady erosion in the crucible of 20th century conservative politics. The state swung 3.8 points to the left in 2020, enough to secure the narrowest of Biden wins, led by heavy swings in the dominant Phoenix metro.
As I touched on in Nevada, the “new” cities of the southwest are more of a political monoculture than we’re used to seeing—they’re more racially integrated with less demographic variation across the metro. In both states, so much of the population is concentrated in one or two counties that rural-urban polarization is hardly a factor—especially so in Arizona. Both the Democratic and Republican vote is highly urban and suburban. And in Phoenix, more prosperous and more highly educated than Nevada, that means an outsized number of suburban Republicans demographically predisposed towards a shift away from the party in the age of Trump.
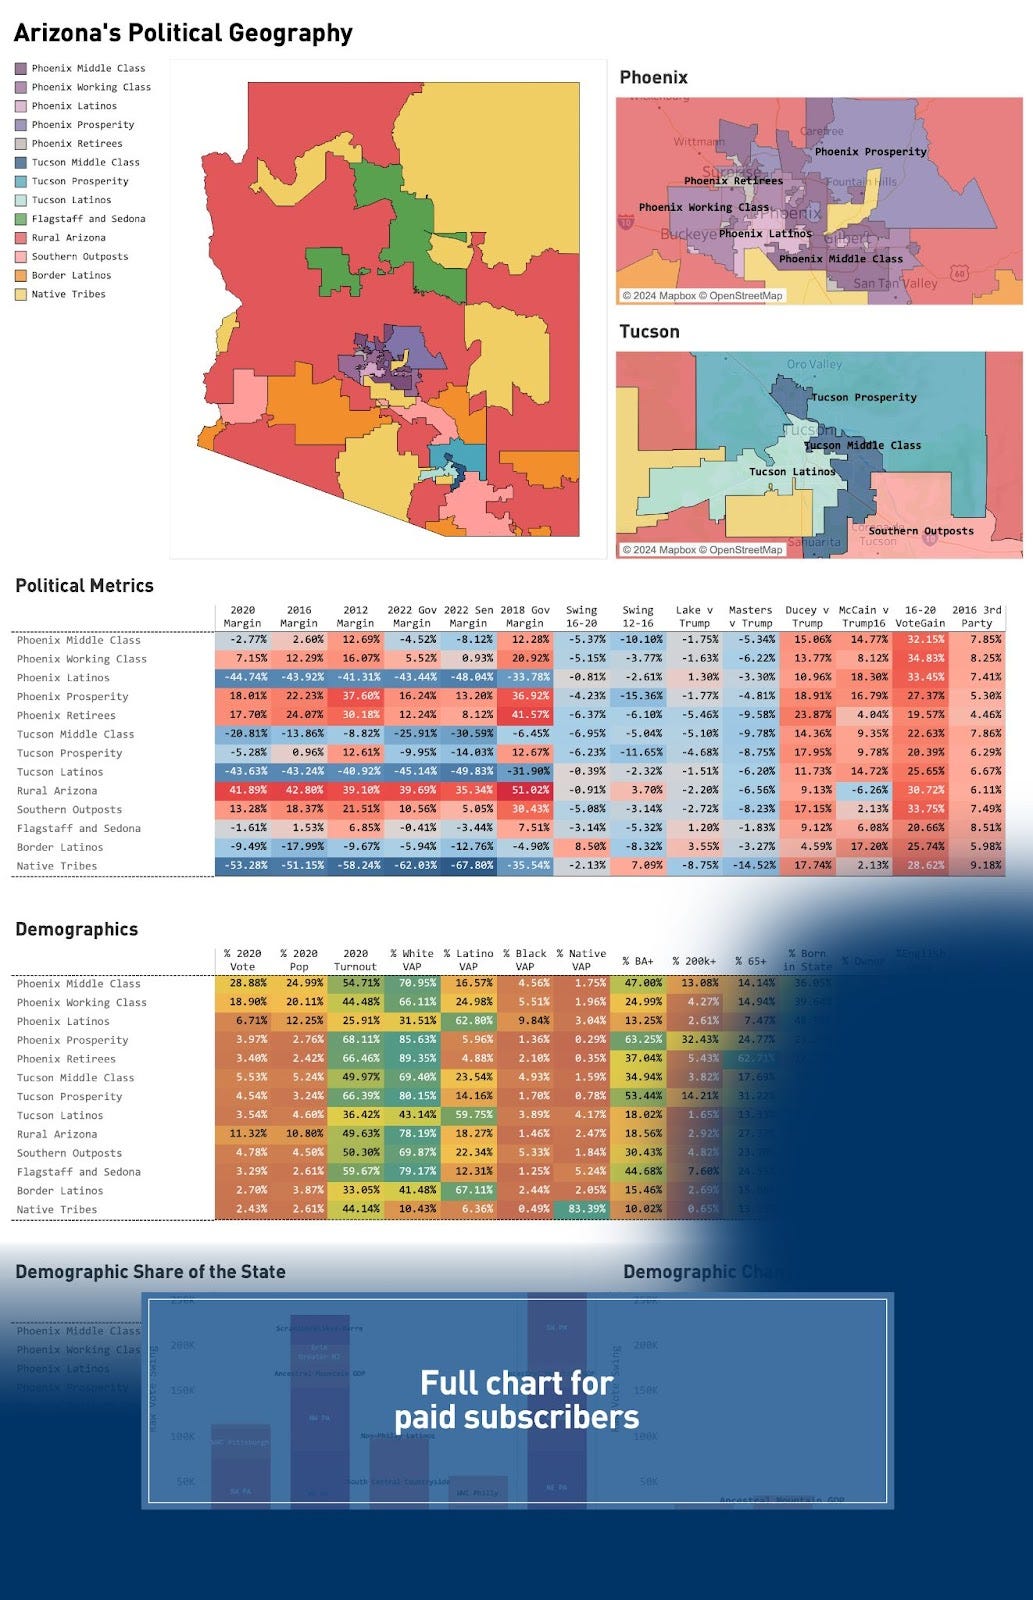
The swing to Biden in Phoenix and Arizona in 2020 reached virtually everywhere — even to urban Latinos — and even white working class-heavy parts of Phoenix swung against Trump in big numbers. Here’s the “balance sheet” of what changed in Arizona from 2016 to 2020 across 13 custom political geographies, built once again with Colin Miller’s Redistricter platform. Phoenix — about 60% of the state — just overwhelms everything else and only Latinos near the border swung to Trump.

The Arizona Mega-Chart
Comparing Arizona and Nevada
The two Southwestern swing states, Arizona and Nevada, are on different long-term political trajectories. Nevada moved not at all between 2016 and 2020 while Arizona swung four points left, reinforcing the trends in recent states over several cycles. On the surface, both states are similar — dominated by one large metro — but Arizona is whiter and more college-educated. As a result, more of Arizona’s Republican vote is concentrated in areas with a high percentage of college graduates, a demographic where Republican voters are cross-pressured in the age of Trump. That has doubtless contributed to Republican declines over the last two election cycles.

A scatterplot matrix for paid subscribers showing trends in political regions in the metros across both states — Phoenix, Tucson, Las Vegas, and Reno — highlights these divergent paths. On the y-axis are three metrics — 2016-20 margin swing, the change in Trump’s share of the vote between 2016 and 2020, and the swing from 2008 to 2020 — juxtaposed on the x-axis with the non-college / working class percentage, the Latino percentage, and the 2016 third party share. The Las Vegas metro immediately stands out as a pro-Trump outlier in its margin swing from 2016 to 2020, something perhaps attributable to this tourist-heavy destination resonating with Trump’s call to re-open the economy in 2020. The Trump overperformance is especially apparent in Latino areas in Las Vegas. The only other place in these two states Trump does do better among Latinos in 2020 is in rural border communities in Arizona, not included on this chart.
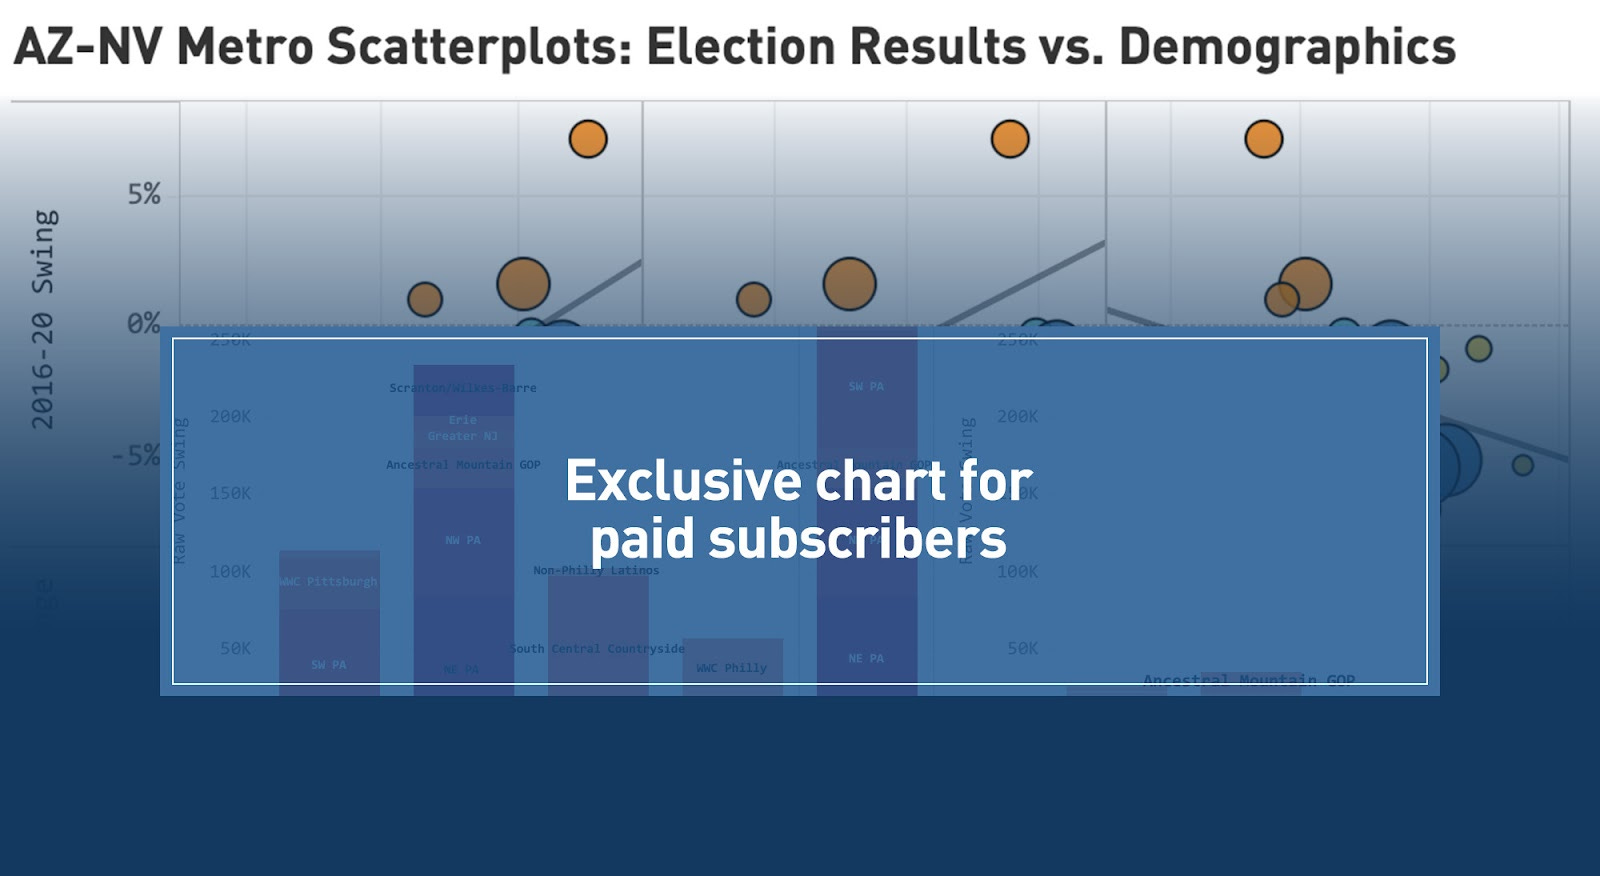
The picture changes when we look at the change in Trump’s share of the vote, which doesn’t vary as much across cities — a tell that the lion’s share of the 2016 third party vote went to Biden. Not coincidentally, Las Vegas was also an outlier in its lower share of the vote cast for third parties in 2016, meaning fewer votes available to swing to Biden. And the lineup of third party candidates was different in Arizona and Nevada. Arizona had a relatively full slate of third party options in 2016 including Gary Johnson and left-wing candidate Jill Stein. Nevada only had Johnson on the ballot and the generic “None of these candidates,” so the 2016 third party vote may have been more left-leaning in Arizona, leaving more slack in the Democratic coalition.
Over a longer time horizon, these two states are traveling in different directions. Since 2008, Nevada has moved about 9 points to the right, while Arizona has moved double digits to the left. Arizona favorite son John McCain was on the ballot in 2008, and I use this year for regional comparisons since 2012 data is not available for Nevada — but Mitt Romney’s 2012 margins were pretty similar in Arizona and about 5 points better in Nevada. Two states that were safely Democratic or Republican in 2008 have converged, and there’s a chance that in 2024, Arizona will lean left of Nevada for the first in a long while.
The Political Geography of Arizona
Phoenix
In no other state does the largest metropolitan area so closely mirror the politics of the state overall. Maricopa County, casting 6 in 10 of Arizona’s votes, used to vote slightly to the right of the state. Now it votes a couple of points to the left. Urban-rural polarization is muted here: outlying suburbs tend to perfectly cancel out the urban, mostly Latino, core and both the region as a whole and large swaths within it are politically evenly split. Red areas are close to blue ones, but much of the region is basically purple. Only Latino-majority neighborhoods make it so that the metro leans slightly Democratic.
After a strong swing left in two successive elections, Phoenix is now the ultimate swing region. In Arizona, there is no “running up the score in the rurals” to counterbalance the state’s major urban center. Victory statewide for both parties runs right through the Valley of the Sun.


Phoenix Middle Class (28.9% of the vote, D+3, D+15 since 2012)
About half of the Phoenix metro — and 29% of the state — is pure middle class suburbia. This region runs mostly in an L shape from the northern reaches of Phoenix proper to the suburbs of Chandler and Gilbert, a new hub for domestic semiconductor manufacturing.
Almost half of residents have Bachelor’s degrees and 13% have incomes over $200,000, making it by far the state’s largest upper middle class voting bloc in raw numbers. 47% of Arizonans with incomes over $200,000 and 38% of the state’s college graduates live here. At 71% white, it’s also a good deal less diverse than the comparable suburban parts of the Vegas metro, and college graduates are 10 points higher as a share of the population.
In 2016, this area swung left by almost twice as much as the state as a whole did — 10.1 points vs. 5.7 points, accounting for most of the raw vote swing to the Democrats that year. In 2020, it moved a further 5.4 points left, but this didn’t stand out as much compared with the state’s 3.8 point shift.
As a whole, the Phoenix middle class suburbs are politically split, with a Biden margin of 2.8 points in 2020. Given its size and the relative lack of polarization across Arizona’s political landscape, a Trump victory in Arizona by the margins we’re seeing in polls today would likely mean he bounced back and won this most important region in the state. Despite Arizona’s reputation as a proxy for the Latino vote, the size and significance of this region show that white suburbanites remain a crucial factor here too.

Phoenix Working Class (18.9% of the vote, R+7, D+9 since 2012)
Split between a western pocket in Phoenix and Glendale and an eastern pocket in Mesa, the Phoenix area’s white majority working class neighborhoods are the state’s second largest block of votes, representing 19% of the vote cast in 2020. But despite a favorable demographic profile — just 25% with Bachelor’s degrees and just 4% with incomes over $200,000, Trump lost ground despite winning here both times, reflecting negative trends in the Phoenix metro overall. In 2016, the swing was 4 points and in 2020 5 points. Working class Phoenix looked different from middle class Phoenix in its 2016 swing, but strikingly, there was no difference between them in their 2020 swing, showing that turnout and third party vote shifts may have mattered more that year.
The area is relatively diverse, with a 25% Latino population. And Latino voters in Arizona were not the boon to Trump that they were elsewhere. The Phoenix working class cast the highest share of third party votes anywhere in the metro, with 8.3%, making it fertile ground for the Biden campaign in 2020. And as in Las Vegas, the working class and middle class areas of southwestern cities are not so different politically, necessitating broadly-based campaign strategies across middle and working class suburbs. The pot of votes is huge: between them, these two regions make up almost three quarters of the vote in Phoenix and almost half statewide.
Phoenix Latinos (6.7% of the vote, D+44, D+3 since 2012)
Latino-majority areas play a lesser but still important role in the Phoenix metro. These working class areas are still very Democratic, with a Biden margin of 44 points in 2020, making up about a quarter of the Latino vote statewide and a bit less than a majority of Phoenix-area Latinos. As always, there is the caveat that voters in highly concentrated minority communities tend to vote more Democratic than members of these groups outside those neighborhoods.
Latino Phoenix, in contrast to many other Latino communities throughout the country, swung slightly against Trump in 2020. Arizona Latinos seem to have been one of the lone holdouts in racial and ethnic depolarization in 2020.
As mentioned earlier, this seems like a distinctive Trump underperformance among urban Latinos in Arizona, as he did better with rural Latinos. The Latino trends in Phoenix proper look good only when compared to the Republican bloodletting through 2020 in the rest of the metro area: Republicans lost just 3 points here since 2012, compared to 15 points in the middle class suburbs and 9 points in the working class suburbs. In a statewide context, there actually was racial depolarization, but it was masked by overall Republican decline in Arizona.
Down the ballot, the area exhibited some positive signs for Republicans in 2022. Kari Lake slightly outperformed Trump here and Blake Masters underperformed less than he did everywhere else in Phoenix, suggesting some positive Latino momentum for the party, but again, that was good news for the GOP only in light of their dismal underperformances elsewhere.
Phoenix Prosperity (4.0% of the vote, R+18, D+20 since 2012)
Arizona’s pinnacle of affluence, this newly developed northwestern part of the metro centers mostly on the wealthier neighborhoods of Scottsdale. Election results here have a decidedly pre-Realignment vibe, supporting Donald Trump by 18 points in 2020.
But that’s only if you look at surface-level results. The Phoenix Prosperity region has swung more than any other in favor of Democrats since 2012 — by 20 points. As with the larger Phoenix Middle Class region, most of this realignment took place in 2016, with a 15 point swing that year alone. This region actually swung less away from Donald Trump in 2020, partly because of its older and more affluent electorate didn’t vote as much for third parties in 2016, leaving fewer anti-Trump voters not already in the Democratic camp. More than 6 in 10 voting age residents here have college degrees and a third have incomes over $200,000, and a healthy 1 in 4 residents are over 65.
Phoenix Retirees (3.4% of the vote, R+18, D+12 since 2012)
The retiree-heavy communities of Phoenix, including Sun City and Surprise, make up the only political region in our battleground series so far to consist mostly of retirees. 63% of the people in this region based in Sun City and other nearby retiree communities are over the age of 65. Overwhelmingly, they are not Arizona natives: just 12% were born in Arizona, the lowest figure anywhere in a state where 4 in 10 residents were born in state.
The region is still solidly Republican, make no mistake, but exhibited a distinctly anti-MAGA trend in 2022. Kari Lake dropped 5.5 points from Trump’s 2020 performance and Blake Masters dropped 9.6 points, notably higher than anywhere else in the Phoenix metro. Meanwhile, Doug Ducey in his 2018 re-election as governor outperformed Trump’s margin two years later by 23 points — more than any other area statewide. These voters actively differentiate between different brands of Republicans, with the spread from Ducey in 2018 to Masters in 2022 a whopping 34 points. Much of this MAGA-aversion emerged in 2020 and after: Trump in 2016 ran just 4 points shy of John McCain compared with a statewide underperformance of 9 points. It’s unclear, however, if this MAGA animus would extend to Trump himself in 2024, or just to downballot candidates perceived as giving voters the chaos without the charm. At 6 points, the anti-Trump swing here in 2020 was only slightly worse what it was in the rest of metro.
Tucson
Making up 13% of the state, Tucson is Arizona’s second metro, and one that’s historically voted to the left of Phoenix. That made it historically a swing region, while Phoenix was solidly Republican. Today, it’s a darkening shade of blue while Phoenix is purple. Late Trump-era trends have been overall worse for the GOP in Tucson, with more robust pro-Democratic swings in 2020 and greater underperformances for 2022 candidates. But lower levels of educational attainment — despite the presence of the University of Arizona — meant the region did not swing as strongly in 2012-16 against Trump, so in effect, 2020 made up for lost time


Tucson Middle Class (5.5% of the vote, D+21, D+12 since 2012)
Covering the southern and western portions of Tucson and home to the University of Arizona, middle class Tucson is solidly Democratic and trending more in that direction, voting for Biden by 21 points and swinging 7 points towards Democrats in 2020 and 12 points since 2012. The 2022 GOP ticket performed even worse here, consistent with a poor performance in Tucson overall, with Masters dropping 10 points from Trump 2020 levels and Lake 5 points. It’s more working class and Latino than its Phoenix middle class counterpart, with 35% with college degrees and 24% Latino.

Tucson Prosperity (4.5% of the vote, D+5, D+18 since 2012)
Centered primarily in the city’s northeastern hills and new growth areas, Tucson Prosperity is made up of the area’s college-graduate majority suburbs. It’s not a direct analogue to the tonier Phoenix Prosperity, since Tucson is smaller and less affluent. 53% have college degrees and 14% have incomes over $200,000 — less than half the number in Phoenix. It looks like more of a hybrid of the Phoenix middle class and prosperity regions.
As in Phoenix, the better off parts of Tucson are the least Democratic, voting for Biden by 5 points. But this gap has been narrowing, consistent with ongoing class realignment, with an 18 point swing left between 2012 and 2020.
Tucson Latinos (3.5% of the vote, D+43, D+3 since 2012)
Tucson’s Latino-majority areas almost perfectly mirror Phoenix’s, with the same Democratic margins and the same trends over the last few election cycles. MAGA candidates underperformed here in 2022, but not to the same extent as in majority-white parts of Tucson, mirroring their behavior in Phoenix. Nevertheless, these 2022 performances were 3 to 4 points worse in Tucson than in Phoenix regardless of demographics.
Covering the southern and eastern sides of the city, these parts of Tucson underscore that Trump has a lot of ground to make up with urban Arizona Latinos, though polls suggest a major opportunity for him to do so in 2024.
The Rest of Arizona
Arizona is a patchwork state, with ethnically diverse Democratic rural outposts, including the country’s largest Native American reservations and border Latinos. Just over half of the state’s non-metro population are quintessentially Republican rural areas and small towns, while the rest leans Democratic. The rural vote is more influential in Arizona than in Nevada, with about 20% of the vote that can be classified as rural, about double Nevada’s rural vote.
Rural Arizona (11.3% of the vote, R+42, R+3 since 2012)
The part of the state that is largely white, rural, and Republican is cut up geographically across the map. It casts 11% of the state’s votes and has seen a modest run-up in Republican margins in the Trump era that stands in contrast to virtually everywhere else in the state. Trump won by 42 points here in 2020, down slightly from 43 points in 2016, and up from Mitt Romney’s margin of 39 points in 2012. Because these rural white working class areas were quite Republican before Trump, there was little room for growth in the Trump era. With the countervailing pre-Trump suburban Republican vote, this made the state all downside for the GOP in 2016 and 2020.
Nonetheless, rural Arizona shows the importance of white rural turnout to any Trump victory in Arizona. Its vote count grew by 31% between 2016 and 2020, just above the statewide average of 30%. Maintaining high rural turnout in a potentially lower-turnout year could make the difference between victory and defeat. Just 18% here have college degrees, but there is a fair amount of diversity, with an 18% Latino voting age population.
Southern Outposts (4.8% of the vote, R+13, D+8 since 2012)
Neither rural nor urban, Arizona’s Southern Outposts are new growth communities and medium-sized towns mostly between Phoenix and Tucson. Arizonans will recognize them by the names of towns like Maricopa and Casa Grande.
These are among the fastest growing parts of the state, with new growth on the outskirts of Phoenix. The Republican margin in 2020 was 13 points, representing a decline of 8 points since 2012, about on par with the state. And befitting its identity in between rural areas and suburbs, it has an average percentage of college graduates — 30%. Demographically, it is a good bellwether for the state, balancing high growth exurbs and more rural communities.
Flagstaff and Sedona (3.3% of the vote, D+2, D+8 since 2012)
The northern parts of the state known for scenic views and tourism consist of three main population centers: Flagstaff, Prescott, and Sedona. These areas are closely divided politically, with a Democratic margin of less than 2 points in 2020, albeit with the same pro-Democratic trend as the rest of the state. But, given its relatively senior-heavy and decently well educated population, one is surprised the shifts aren’t more like the double-digit ones in Phoenix. The area overall shifted a net of 8 points since 2012, 3 points of that from 2016 to 2020.
Flagstaff and Sedona was one of the regions where Kari Lake performed better than Trump in 2020, and was Blake Masters’s least underperforming region (-1.8 points compared vs. Trump 2020). Doug Ducey did not get a tremendous boost here either — in contrast to older and more prosperous parts of Phoenix. MAGA holds up relatively well here compared to the retiree meccas to the south in Phoenix.
Border Latinos (2.7% of the vote, D+9, R+0 since 2012)
Encompassing border adjacent rural areas with heavy Latino populations, this is the battleground state region most analogous to South Texas’s Rio Grande Valley. It had a healthy 9 point swing to Donald Trump in 2020, and the swings in border towns — San Luis, Nogales, and Douglas — were positively RGV-esque, 20 points or more. The most common address for the people who live here is the city of Yuma on the California border.
The catch is that the population here is small, and positively tiny in the border towns. Border areas are a larger force in Texas than they are in Arizona, and the voting patterns here show a stark contrast, with a Democratic margin of 9 points in heavily Latino rural areas compared to 40+ point margins in Phoenix and Tucson. Some of this is that there are some very Republican rural whites here, but nevertheless, the differences with the cities are clear.
The long-term trend is also more ambiguous. Trump lost 8 points here in 2016, and his 2020 gains basically canceled out that loss. To win Arizona with the help of Latinos, Trump will need a surge both from Border and urban Latinos.
Native Tribes (2.4% of the vote, D+53, R+6 since 2012)
Arizona’s Native vote is small but powerful — and absolutely unmistakeable on any political map. From the Navajo nation occupying virtually the entire top left quadrant of the state to several other reservations spread throughout Arizona, the Native vote is a powerful Democratic engine, with a 53 point margin in 2020.
However, this healthy margin represents a 6 point decline from 2012, making Native Americans the best performing ethnic group (in terms of gains) under Donald Trump. And the trend was in reversal as of 2020 — an 8 point gain in 2016 turned into a 2 point loss. Tribal voters actively differentiated against the party’s 2022 candidates, with a 15 point underperformance from Blake Masters compared to Trump and 9 points against Kari Lake. This level of ticket-splitting exceeds that of Phoenix’s seniors.
With an 84% Native population, the region is an outlier in its high levels of poverty and low rates of education. Just 1 in 10 have degrees and the average household income is just $49,000.
Paid subscribers will see exclusive charts below. If you appreciate the analysis and the visuals, I hope you’ll consider subscribing.
Keep reading with a 7-day free trial
Subscribe to The Intersection to keep reading this post and get 7 days of free access to the full post archives.