

The Intersection’s way-too-early 2028 Democratic primary model
Yes, it's next to impossible to predict. So what?

Note: This model has been updated on October 16, with the introduction of JB Pritzker and Wes Moore as candidates. Bookmark this page for future updates.
This newsletter is officially wading into the world of electoral forecasting with a 2028 Democratic primary model.
Okay, okay — you’re probably wondering how it’s possible to forecast a contest almost three years out with no announced candidates.
Close to the election, we have lots of polls to help us model the outcome of races. And as much as these models claim to be “predictive,” they’re really just a probabilistic representation of the current polls with some uncertainty layered on.
Further out, we have to rely on fundamentals — factors like charisma, electability, fundraising, and demographic appeal. As I wrote last year, any model that tries to factor in fundamentals is inherently reliant on the forecaster’s choice of what gets counted and how each candidate gets scored.
That’s especially true here, since polls this far out will be far less predictive, so we need to handicap each candidate on a fundamentals rating. But I’ll not only be telling you what these fundamental scores are and how they’re built — but in a future model release I’ll give paid subscribers access to the simulation interface to be able to tweak the candidate scores and the simulation settings.
The latest 2028 Democratic primary model has Gavin Newsom ahead in a nine candidate field with a 24.6% chance of winning across 10,000 simulations.1 That’s down from his initial 29.7% odds in a seven candidate field. Alexandria Ocasio-Cortez’s odds remain essentially unchanged at 19.3%, while Pete Buttigieg goes from 13.4% to 11.8%, Gretchen Whitmer from 11.3% to 11.6%, Josh Shapiro from 12.2% to 9.9%, Cory Booker from 9.0% to 8.8%, and Andy Beshear from 5.1% to 5.2%.
In their debut, Wes Moore has a 5.7% probability of being nominated while JB Pritzker is at 3.3%.
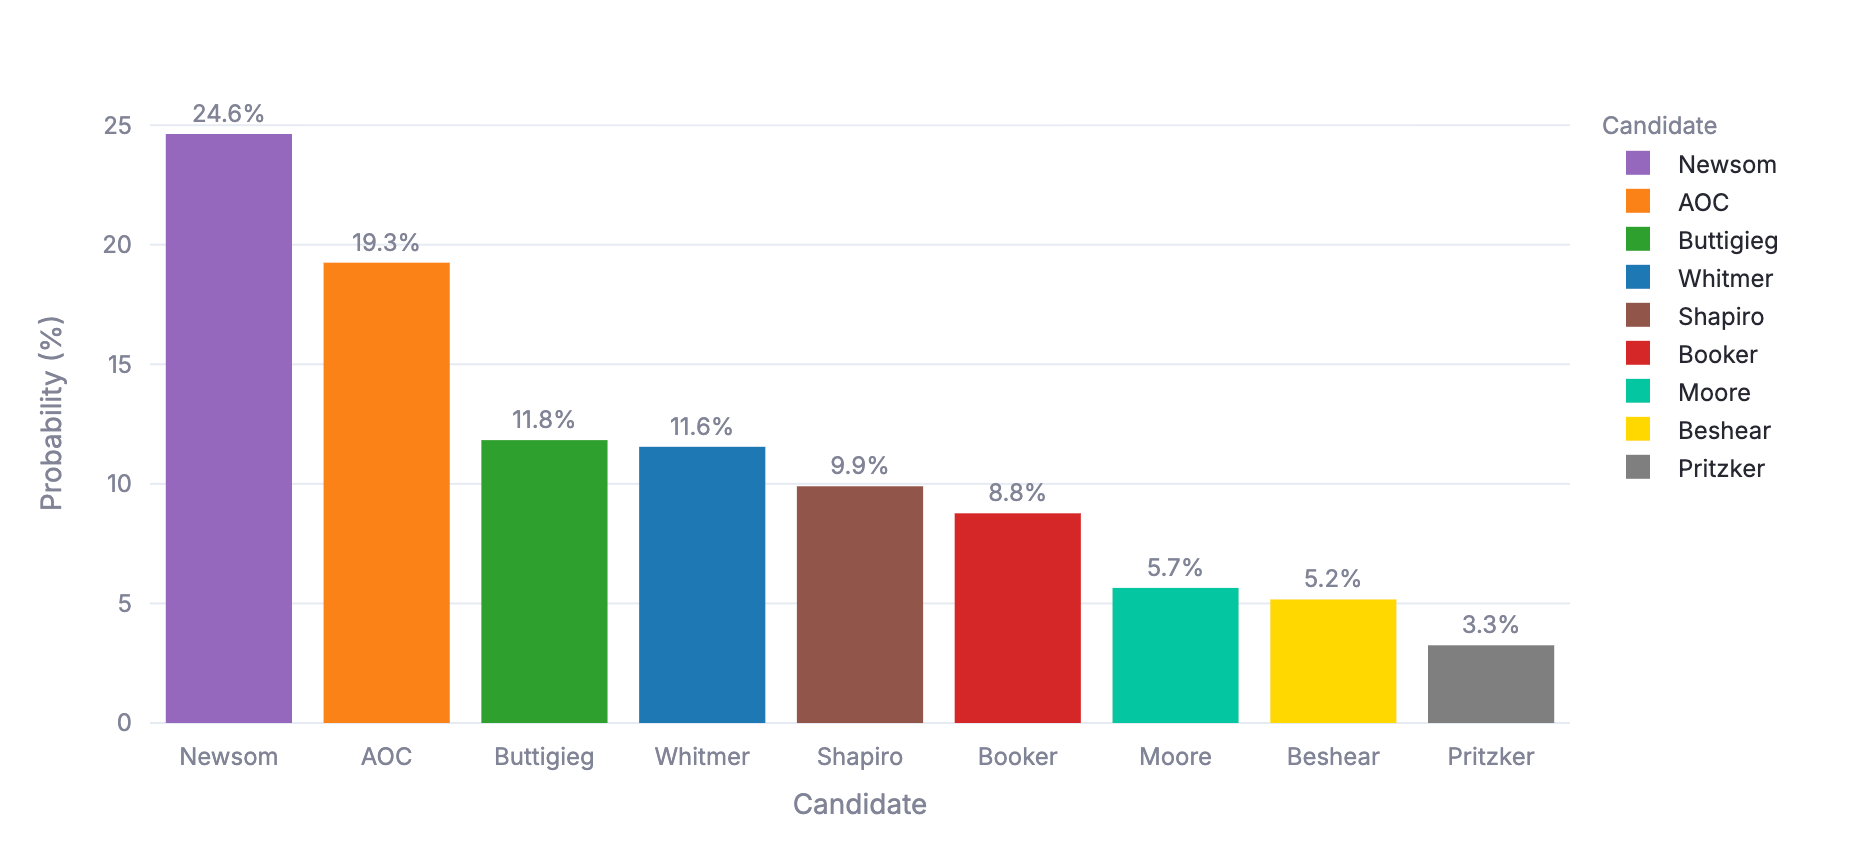
Watch out as future candidates are added. The increasing size of the field does put a dent in the odds of some of the more “mainstream” candidates like Newsom and Buttigieg as it ups the odds of fragmentation.
In describing this model, I use the word “simulation.” I think that’s perhaps an even more useful description of this than a model. This project recognizes the reality that there is a campaign still to be waged, and the quality of the individual campaigns matters deeply. How candidates “play” the game — deciding to invest resources in certain states or doubling down on certain demographics — is decisive. By simulating the mechanics of a primary, we can tweak certain inputs and then see what the payoff is in terms of changing probabilities.
As I mentioned before, we start with a “fundamentals” model. Prior to the race starting, the model applies random variation to each candidate’s starting fundamentals score. And then the model goes through each of the 57 contests, adjusting candidate strength based on home states, state demographics, state ideology, and momentum from previous contests. The model has dropout mechanics after each round and simulates the effects of ideological lane consolidation.
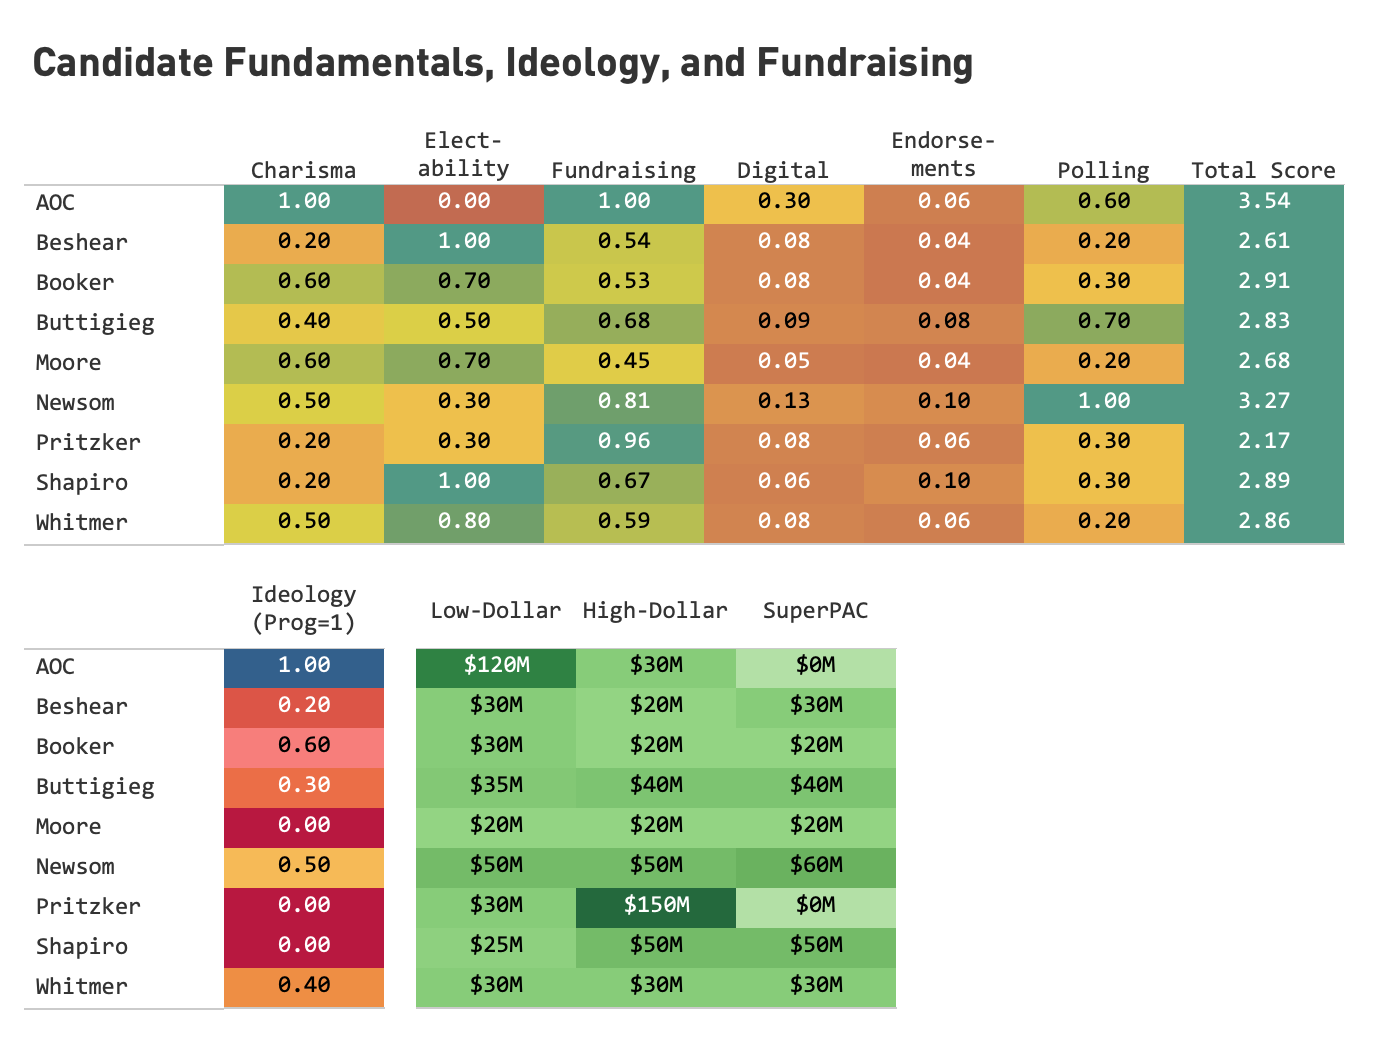
You’ll notice here that while AOC has the highest fundamentals score — highest on charisma and money — the model doesn’t consider her the favorite. That’s mostly because the model thinks she can do well against a large field as the only true progressive, but will inevitably struggle against moderate and liberal consolidation deep into the calendar. Newsom starts out very close to her in the fundamentals, with the best polling at the moment, the second-best fundraising, and ideological positioning in the middle of the party. The combination of these factors helps him overtake her. Meanwhile, the model doesn’t like Pete Buttigieg relative to his early polling since he doesn’t excel on any of the non-polling dimensions. Shapiro has an electability advantage and is considered a strong fundraiser. Whitmer is from an early state. And Booker could have a chance to catapult to the top tier with a strong showing with Black voters in South Carolina — historically a reliable pathway to the nomination.
As a paid subscriber or by signing up for a free trial, you can read on to see delegate accumulation over time, full state-by-state probabilities, candidate survival rates by primary, projected momentum across contests, and delegate distributions including likelihood to win pledged delegate majorities.
