

North Carolina, State of Equilibrium
Can Kamala Harris reverse her party's presidential curse in the Tarheel State?

No battleground state has shown more stability in its results over recent election cycles than North Carolina. It’s a once-solidly Republican bastion that’s become a perennial battleground since Barack Obama won the state in 2008. Nevertheless, Democrats have fallen just a little short here in the three successive elections since 2008, making it the Democratic version of what Nevada is to Republicans.
The state’s unique stability shows up in a metric known as the lean: how many points to the right or left of the country did the state vote? In the last three election cycles, North Carolina has mirrored national trends perfectly, leaning to the right of the country by 5.9, 5.8, and 5.8 points respectively.

In contrast to Georgia and Arizona, which went blue last cycle, North Carolina is the model for what a GOP “soft landing” in the Sun Belt could look like—one where the state has gotten more Democratic with its booming metros, but still remains just far enough to the right of the country to remain frustratingly out of reach for Democrats. It’s a model that the GOP hopes it can recreate in Texas.
For all of these reasons, the state wasn’t even considered one of the main battlegrounds when Joe Biden was in the race but has since been upgraded to that status with Kamala Harris as the nominee. The polls put North Carolina in striking distance of being the only Trump 2020 to state to flip to Harris, though the polls have been wrong here before.
In 2016 and 2020, polls have performed worse here than in the rest of the Sun Belt, almost as much as they did in the Rust Belt. By most measures, it’s the most rural battleground state. And it’s less racially polarized than Georgia, meaning that white voters in rural areas tend to be a touch more open to Democrats. If the polls aren’t capturing those shifts, it’s the same recipe for polling error we see in a more extreme form in a state like Wisconsin.
Within North Carolina, shifts within the state’s political regions have mostly canceled each other out. Yes, Democrats have made significant progress in the state’s educated suburbs, shifting them anywhere from 18 to 20 points left in 2016 and 2020. And Republicans have engineered countervailing shifts in the state’s rural areas, though not as large as the ones in the suburbs. The reason why Democrats haven’t been able to capitalize on this, though, is reduced turnout among the state’s Black voters, which have significantly cut into the Democrats’ raw vote margins in those communities.
Built once again with the help of Colin Miller’s Redistricter, the political geography of North Carolina is made up of 18 distinct regions, divided up along clean urban/rural lines in the central and eastern parts of the states, with more of a racial and ethnic patchwork in the rural eastern part of the state that makes this area a decisive battleground.

We can see the importance of the Black vote to Democratic success in North Carolina in the net margin contribution that our different political geographies make to Republican and Democratic margins respectively. In 2008, Black-plurality voting blocs contributed 4 in 5 net Democratic votes in Democratic areas. By 2020, they only contributed slightly more than half, with the educated suburbs — especially around Raleigh-Durham — growing in importance. On the right, Republicans have become singularly more dependent on huge margins out of rural central North Carolina, as they’ve lost their raw vote advantage in former bastions like the Charlotte suburbs.

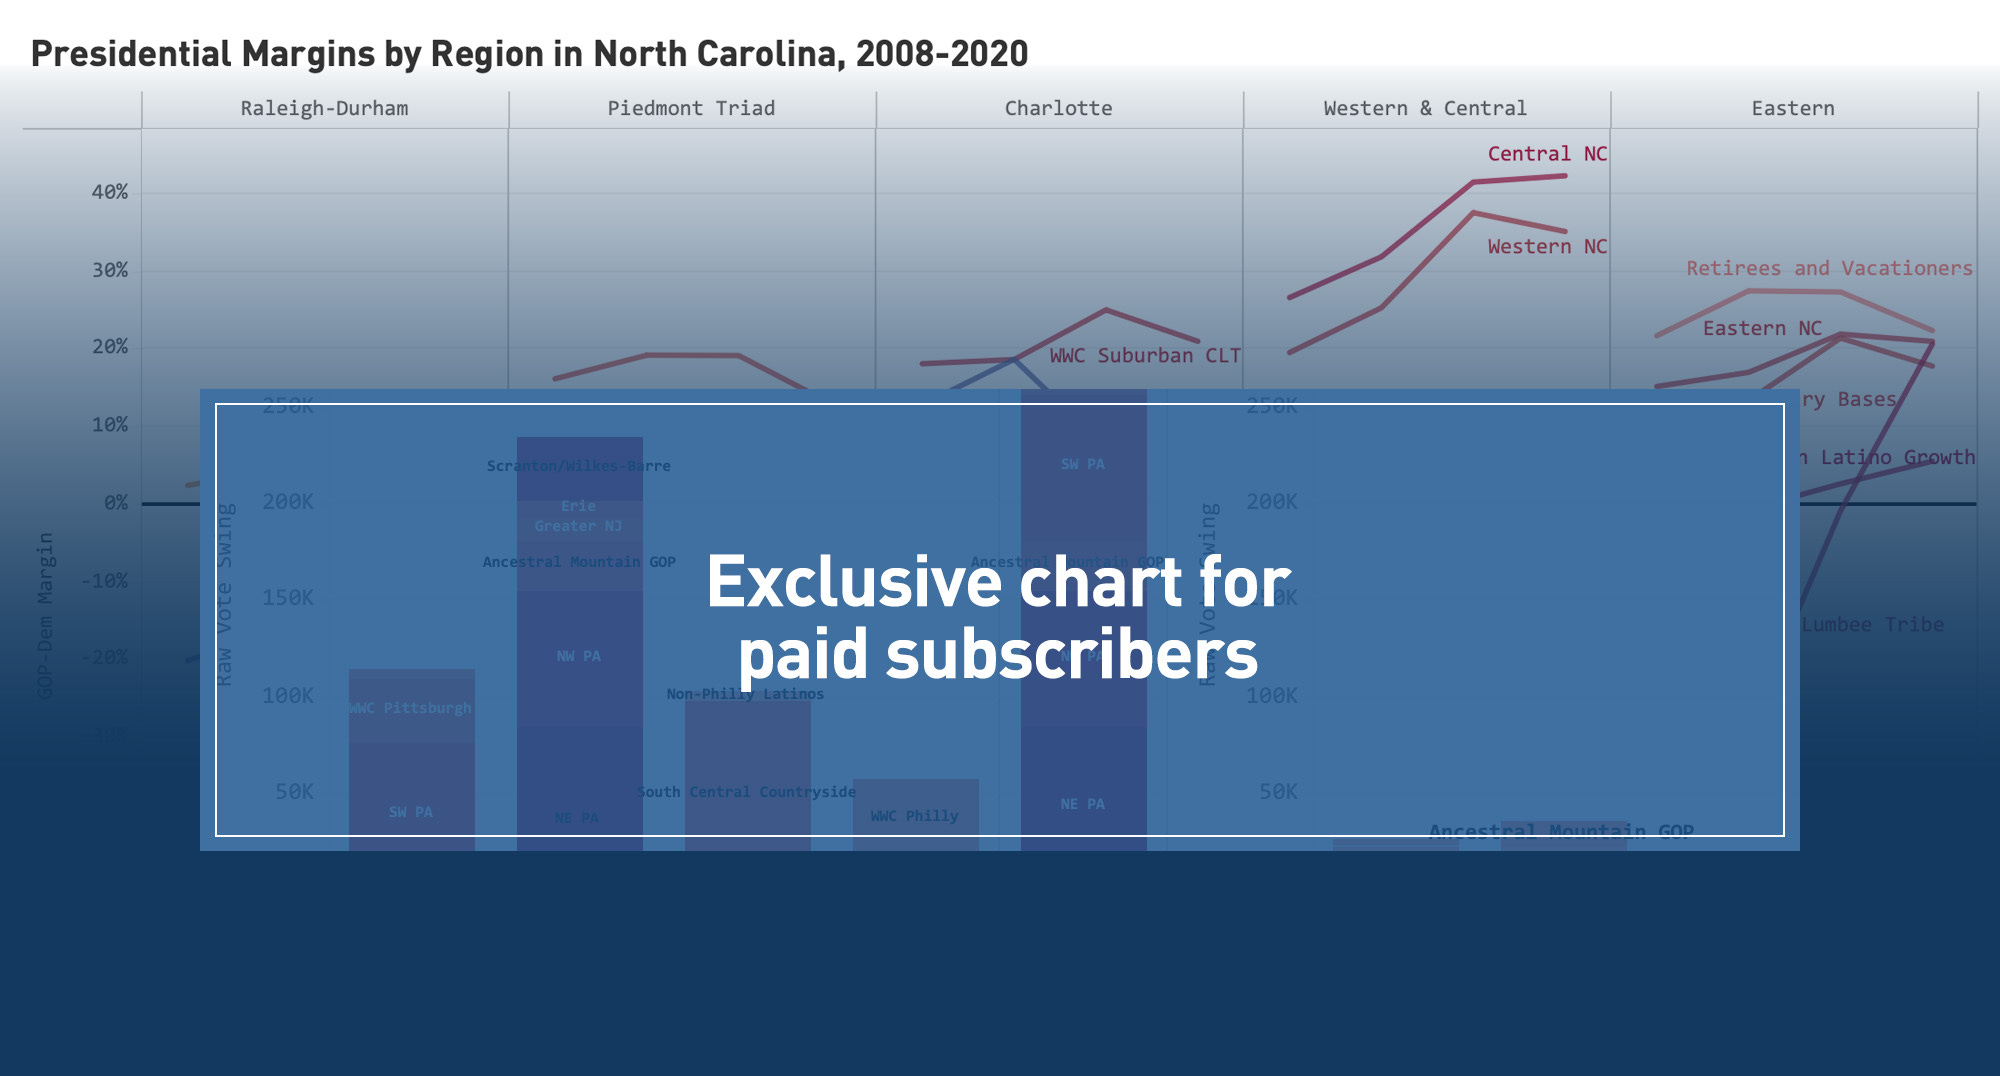
The following chart for paid subscribers shows exactly how all the regions have evolved from cycle to cycle from 2008 to 2020, including the largest single swing in any region of the country covered so far and the distinctly different partisan baselines in each of the state’s three main metros.
North Carolina also invites comparisons to Georgia, the other main southern battleground. Based on demography alone, North Carolina should vote to the right of Georgia, with a larger population of rural whites and a smaller Black population. But differences in state political cultures matter, and these differences keep both states competitive in their own way.
In North Carolina, whites in every category vote well to the left of whites in Georgia, from the Research Triangle suburbs which have long had a liberal tilt to the fact that rural North Carolina whites don’t match the 80-90% support their Georgia candidates give to Republican candidates.
In 2016 and 2020, the Atlanta suburbs saw extreme drops in Republican support, largely because they started out as extremely Republican to begin with, and any new population influx by default has the potential to make them much closer to 50-50. In Atlanta, the wealthy suburbs moved 36 points in 2016 and 2020, while the diversifying, further-out suburbs, moved 22 points, in excess of the most extreme North Carolina, 20.5 points in the Charlotte suburbs. But the key difference here is that the Atlanta suburbs started out well to the right of the Charlotte suburbs, and now they collectively vote about the same way, at a near 50-50 split. Republicans simply had more room to fall in Georgia.
Georgia also has a growing Black population which North Carolina doesn’t. As these new residents replace white suburbanites and exurbanites (Republican by 40 points or more), the swings can be pretty extreme.
But because Georgia has a larger Black population, any drop in Black turnout this year will automatically means a bigger swing back to Trump in Georgia, something are possibly seeing reflected in the polls and the early voting data so far.
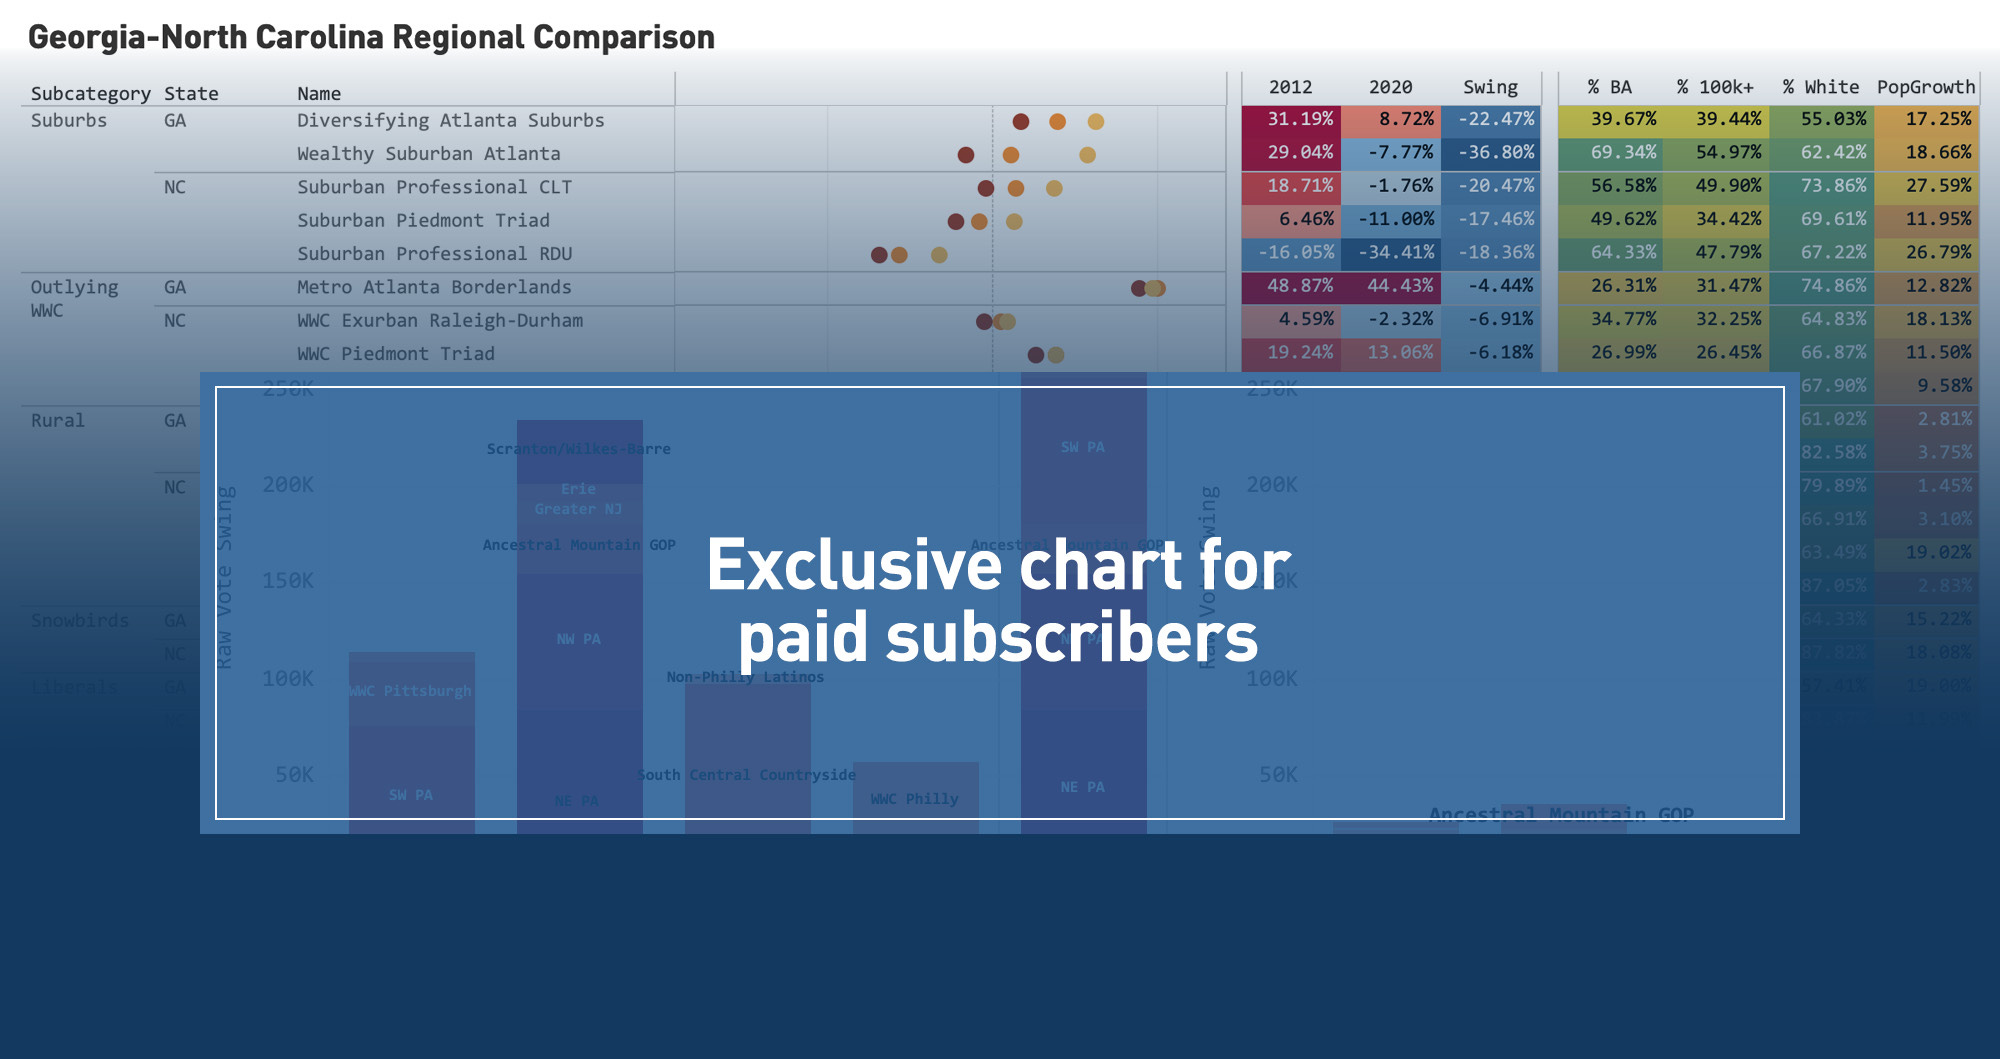
This chart for paid subscribers, available at the end of the piece, goes into a lot more detail, comparing regions in North Carolina with similar regions in Georgia.
Raleigh-Durham Metro — 19% of the vote
Befitting its name, the Research Triangle region is dominated by college-educated voters, many of them employed in higher education, technology, and medicine. The region casts 19% of the state’s vote, with almost two thirds of its residents living and voting in neighborhoods with college-educated suburban majorities. Predictably, the region is the most solidly Democratic in North Carolina.
Suburban Professional Raleigh-Durham, 11.7% of the vote, Biden +34, D+18 since 2012
Black Raleigh-Durham, 2.4% of the vote, Biden +69, R+2 since 2012
White Working Class Exurban Raleigh-Durham, 4.5% of the vote, Biden +2, D+7 since 2012
Suburban Professional Raleigh-Durham encompasses most of the area in between Raleigh proper and Durham, home of Duke University, and extending outward to Chapel Hill and the University of North Carolina. 64 percent of the adult population over 25 have college degrees — by highest in the state — and it’s swung solidly to the left, a combined 18 points in 2016 and 2020, and 6 points in 2020. Like other white-collar suburban areas, it’s prone to ticket-splitting benefiting a “normal” Republican — Thom Tillis performed 6 points better than Trump here in 2020.
Demographically, Metro Raleigh-Durham is structured similarly to the state’s other metros, with separate regions for “suburban professionals,” Black voters, and white working class exurban areas absorbing most of the new growth. In the Triangle region, the population is slanted much more towards the professional class, with higher levels of educational attainment than similar parts of other metros.
Black neighborhoods in central Raleigh and Durham cast 2.4 percent of the state’s vote, and are the only areas to move right under Donald Trump, albeit by just two points.
The exurban areas to the east and west of the metro are politically split, but have been getting bluer as they’ve absorbed the bulk of new housing construction, especially to the southeast. The area representing 4.5 percent of the state’s vote is still relatively working class, with 35% who have Bachelor’s Degrees, and has a white voter majority, 65%, but Biden won them by 2 points in 2020 as did Cheri Beasley in 2022. The same region was won by Trump by 2 points in 2016 and Romney by 5 in 2020.
As Kamala Harris might say, the exurbs of Raleigh-Durham did not just fall out of a coconut tree. They are shaped by all that they are a part of and all that came before them — the liberal Research Triangle region that’s high in both education and income (but definitely higher in education than income).


Piedmont Triad — 9% of the vote
The Piedmont Triad, or Greensboro, Winston Salem, and High Point, is smack in the middle geographically and politically of metro North Carolina. It’s an historic home of the state’s blue-collar industries—including manufacturing (like textiles and furniture) and tobacco. It’s the smallest metro, casting just 9 percent of the vote, and growing slower than either Raleigh-Durham or Charlotte.
Suburban Professional Piedmont Triad, 4.9% of the vote, Biden +11, D+16 since 2012
Black Piedmont Triad, 2.0% of the vote, Biden +65, R+6 since 2012
White Working Class Piedmont Triad, 2.2% of the vote, Trump +13, D+6 since 2012
Despite its different political leanings and economy, swings in different parts of the Piedmont Triad largely echo the Research Triangle. Its suburban professional region has swung 16 points since 2012, but with a much less pronounced Democratic advantage in 2020, 11 points. With 5 percent of the state’s vote, it encompasses a narrow majority of the region’s voters.
Black urban majorities in the Triad voted for Biden by 65 points, a margin commensurate with similar areas statewide, but showing a more definite rightward swing of 6 points since 2012. With more muted growth in the region, there’s little gentrification in these areas, giving us a cleaner read of the dynamics among working class Black voters.
The further-out exurbs voted for Trump by 13 points in 2020, but with a margin drop of 6 points from 2016. Just as with Raleigh-Durham, they’re absorbing the bulk of any new growth the region is experiencing, with a 17 percent growth in votes cast between 2016 and 2020, compared to 12 percent in the suburbs and 3 percent in Black-majority neighborhoods.


Charlotte Metro — 18% of the vote
Charlotte is a proper New South metro, much closer politically to Atlanta than to a more Northern-adjacent metro like Raleigh-Durham. The metro used to be the backbone of the state’s traditional Republican vote.
Suburban Professional Charlotte, 9.4% of the vote, Biden +2, D+20 since 2012
Black Charlotte, 4.5% of the vote, Biden +57, D+1 since 2012
White Working Class Charlotte, 4.1% of the vote, Trump +21, R+2 since 2012
Charlotte’s professional-class suburbs, with 9.4 percent of the state’s vote, started and remained the most conservative urban areas in the state in the age of Trump. They swung more heavily to Democrats across the two Trump elections, by 20 points. That’s possibly because there was more room to fall: Romney won them by 19 points in 2012, ending up in a 2-point Biden victory in 2020. Trump-era polarization showed few signs of deceleration in 2020, with a 9 point swing left.
If the Research Triangle is higher in education than income, suburban professional Charlotte is higher in income than education. It has fewer voters as a share of the adult population with Bachelor’s degrees — 56 vs. 64 percent, but more with incomes over $200,000 per year — 19 vs. 17 percent. That’s in part a reflection of the local economy—Charlotte is one of the main centers for banking and finance in the U.S.; for the Research Triangle it’s biotech.
The region is also growing more quickly than the rest of the state’s metros. Suburban professional Charlotte led the way with 25 percent vote growth, with 18 percent in both the Black-majority areas and working class suburbs.
Black Charlotte represents 4.5 percent of the vote and is growing thanks to gentrification from the borders of the professional-class neighborhoods. As a result, the Black plurality is not as strong, at 46 percent, compared to 59 percent in the Piedmont Triad neighborhoods and 49 percent in the Raleigh-Durham neighborhoods, and there’s no Trump-era shift right. On a precinct map, we only see a swing right in the core neighborhoods close to downtown.
Outlying parts of the Charlotte metro have proven more immune to growth from suburban professionals: they voted for Trump by 23 points in 2020 and swung right 2 points since 2012. Most of the growth, and leftward shift, has been in areas with college-educated majorities, which makes those traditionally Republican areas one of Kamala Harris’s prime opportunities to make gains in the Tarheel State.


Western and Central North Carolina — 25% of the vote
Central North Carolina, where one in six North Carolina votes will be cast, has been the engine of GOP margins statewide, with the party’s presidential margins expanding 10 points to 42 points in the Trump elections. It alone will likely contribute half of Trump’s margins in Republican-leaning areas of the state, offsetting blue cities and the Black vote. Meanwhile, western North Carolina is politically much more mixed, with a smaller Republican rural region and liberal-leaning Asheville.
Central North Carolina, 16.6% of the vote, Trump +42, R+10 since 2012
Western North Carolina, 4.8% of the vote, Trump +35, R+10 since 2012
Western Liberals, 3.7% of the vote, Biden +16, D+11 since 2012
Encompassing towns like Hickory, Statesville, and Salisbury, the rural central parts of North Carolina have been a Republican bulwark, voting closer to the hyper-Republican rural North Georgia (Trump +58 in 2020) than anywhere else in North Carolina. Just 19% have degrees and the region is 80 percent white, and is a hub of furniture manufacturing. One red flag for Trump is that the region is that the Census says the region is growing more slowly than other parts of the state, though it did post a 15 percent gain in total votes cast in 2020, roughly on par with 17 percent growth statewide.

Western North Carolina is split politically between Republican rural areas and the Democratic-voting liberals of Asheville. The area as a whole casts 9 percent of the state’s vote, 5 percent in the rurals and 4 percent in the Asheville and Hendersonville-centered Western Liberals region. While the latter isn’t consistently blue all the way across, it has many more college graduates and trended noticeably bluer in 2020. As a whole, the rural Western NC region went for Trump by 35 points while Western Liberals went for Biden by 16, the latter trending 8 points left in 2020, the second largest swing save for suburban Charlotte. Outside the suburbs, we notice big swings left across states in areas with lots of vacation homes, where remote office workers may have relocated temporarily (or permanently) due to the pandemic.
There’s rightly a big focus on any dislocation from Hurricane Helene and its impact on voting in Western North Carolina. The areas most affected seem to be a mix of red and blue, but with some concern for the GOP if its lower-income, non-college voters are the ones who don’t return.

Eastern North Carolina — 29% of the vote
The eastern parts of North Carolina are one of the most diverse and interesting political geographies anywhere in the battlegrounds. Unlike the relatively straightforward divisions we’ve seen so far, eastern North Carolina is home to many different niche communities, many of whom are electorally in flux and may represent Donald Trump’s biggest opportunities in the state.
Eastern Rural North Carolina, 16.0% of the vote, Trump +21, R+4 since 2012
Rural Black Belt, 5.8% of the vote, Biden +39, R+6 since 2012
Retirees and Vacationers, 4.2% of the vote, Trump +22, D+5 since 2012
Military Bases, 2.1% of the vote, Trump +18, R+4 since 2012
Eastern Latino Growth, 0.7% of the vote, Trump +6, R+6 since 2012
Lumbee Tribe, 0.5% of the vote, Trump +21, R+49 since 2012
The main rural eastern rural region has a majority white electorate and is solidly working class. It’s the second largest regional voting bloc in the state at 16 percent, and voted for Trump by 21 points in 2020, but only shifted right by 4 points since 2012.
Lower Trump levels compared to other rural areas are a function of a larger Black vote in this part of the state, 21 percent versus 10 percent in central North Carolina and 3 percent in rural Western North Carolina. But with the possibility of a stronger Black swing to Trump, some of the slack in the Republican vote might go away and it might inch closer to its more conservative central and western counterparts.
Within this eastern region is a largely rural Black-majority region casting 6 percent of the statewide vote. It voted for Biden by 39 points, with Democratic margins reduced by 6 points since 2012. Turnout here might be the big story: the area shrunk by 3 percent in population from 2000 to 2020 even as the state as a whole grew 30 percent. But if you were looking for Trump to further eat into Democratic vote margins among African Americans, you’d look first to the more rural, socially conservative electorate in the eastern Blakc Belt.
Coastal vacationers and retirees (plus Pinehurst) cast 4 percent of the state’s vote, and like other retiree and vacation-centric communities nationwide, it swung strongly Democratic, by 5 points in 2020 and a total of 10 points in 2016 and 2020. Trump’s margin was still healthy — 22 points — though this might represent an opportunity for Harris and Democrats moving forward.
The only region in the battlegrounds delineated primarily as military, North Carolina’s military bases have moved right in the Trump elections, by 8 points in 2016, before swinging back by 4 points in 2020. Trump won them by 18 points in 2020.
Growing up around the state’s meat processing plants in the central and eastern parts of the state is a growing working class Latino population. This area is small, with 0.7 percent of the state’s vote cast, and Latinos make up at most a third of the population and less than that in terms of actual voters. But the area is a microcosm of Trump’s multiracial working class coalition, voting Republican by 6 points in 2020, with all of that margin the result of a swing right in 2016 and 2020.
The largest swing anywhere in the swing states comes from the Lumbee Tribe in Robeson County, swinging a total of 49 points since 2012—27 points in 2016 and 21 points in 2020. The tribal areas cast just 0.5 percent of the statewide vote, but in terms of raw votes, the swing was just as significant as that in the much larger rural Black Belt. The shift is filtering downballot, though with some lag, as Tillis performed 8 points worse than Trump in 2020, though still winning the area.

If the Charlotte and Raleigh suburbs continue to swing left, expect the main counterweight to be Eastern North Carolina, with its diverse, working class, and rural electorate.
Paid subscribers will find exclusive charts below. As a paid subscriber, you will also receive a free preview of the final post in this series, on Michigan, and full access to the archive on all the previous battleground states covered, including Arizona, Georgia, Nevada, and Pennsylvania (part 1 and part 2), and Wisconsin. I also recently adapted this series for a piece in the New York Times on the 21 micro-communities that could decide the election.
These geographic breakdowns take time to produce, and if you appreciate the analysis and the visuals, I hope you’ll consider becoming a paid subscriber. -Patrick
